Free Statistics

of Irreproducible Research!

Author's title

Author*The author of this computation has been verified*
R Software Modulerwasp_bootstrapplot1.wasp
Title produced by softwareBootstrap Plot - Central Tendency
Date of computationThu, 01 Feb 2018 10:43:42 +0100
Cite this page as followsStatistical Computations at FreeStatistics.org, Office for Research Development and Education, URL https://freestatistics.org/blog/index.php?v=date/2018/Feb/01/t1517478272bo5c4zkngwfutu6.htm/, Retrieved Sun, 28 Apr 2024 22:13:29 +0000
Statistical Computations at FreeStatistics.org, Office for Research Development and Education, URL https://freestatistics.org/blog/index.php?pk=314320, Retrieved Sun, 28 Apr 2024 22:13:29 +0000
QR Codes:

Original text written by user:
IsPrivate?No (this computation is public)
User-defined keywords
Estimated Impact47
Family? (F = Feedback message, R = changed R code, M = changed R Module, P = changed Parameters, D = changed Data)
-       [Bootstrap Plot - Central Tendency] [] [2018-02-01 09:43:42] [b4eb4e7d51ac7c2a06834010715bd746] [Current]
Feedback Forum

Post a new message
Dataseries X:
1.72923686058208
0.122433126801145
0.523768788982079
-0.50175942601324
-1.86386120887019
0.0717422351702872
-0.380578531491989
-0.29851611788274
1.94316215667028
-1.24779901378139
1.35257277275093
2.84406850014719
1.12274878943606
-2.32540657982629
-2.89902363942181
0.246874012745119
-0.731094375584061
1.97769407549524
-0.089308186457892
-1.64931358279907
1.78988776616251
-0.655026882699021
-0.95518008982139
-0.501427837065876
-1.47468882156665
2.4255103110643
-0.388732570521789
-1.41970373897772
-0.435743764210552
0.588337253253952
-1.73087780677345
0.416192838768035
-0.135602934239543
1.5607508968729
-0.619488852927662
0.130061173484127
-0.485714783249833
1.19042117073251
0.504940688912012
-0.266725732456376
1.8987616014054
0.9835731579105
0.221023228988728
-0.176860990484583
-0.162198287814433
0.78911590880292
1.41209201053576
0.518161844628975
2.36462043434148
-1.24446105804486
1.09138861156198
0.422175612267996
-0.997989397904933
0.754650745534752
-1.44375392644115
0.568632265545353
1.35413305240232
-1.34288885715882
-0.0968579661829751
0.242767533935212
0.255744783559028
-0.243232899636027
0.461607264600104
0.0650797112167817
2.25999343044582
1.80462197944889
2.32548979115297
0.682758803307819
-0.335554613197298
-0.997929583796738
0.97507128242145
-1.17268516900173
-0.000337278483281606
-1.71460596672184
-1.34872342854985
-1.6521456119588
-1.48335049731373
0.925016701443022
-0.226525557050897
0.774905929042345
-0.339789522342372
0.89311055438168
-0.864578780222597
-1.95217915873499
-0.11317194501752
1.02470860347022
-1.25650654087286
-0.602130638597027
-0.83233134657693
-0.446577198612737
-4.01053303468812
0.288513333839785
-1.00798474916531
-0.572816189634855
-0.297410570159231
1.21578539483534
-0.727486991378146
-0.843943364912431
-1.20889338911855
-0.649656515850742
3.19984732249364
0.572738529480399
-0.0199646221520179
0.462316869083462
-1.28699501625665
-1.80757939159691
-2.15431670426712
0.707840316820782
1.36410372036211
0.314718394752158
-4.1002515835693
1.26992188862053
1.80144339707427
-0.42970220964945
0.529993653035631
1.18764422512472
-0.398233352310507
-0.421884162222733
-2.6898323919027
1.0140628812162
-0.542058945797581
-0.368690243263354
1.31411524584048
-0.428705333764204
-0.663582558495647
1.37204511801761
-1.27310996987184
0.810157913937622
1.5741305304336
-1.025150115941
-0.998930862337702
-0.0536208441845616
1.66337771592794
-0.178008462116163
-1.09164775518912
1.96797905166753
0.634220496887586
1.38764487483822
0.75570654001001
-2.3214750727902
1.62023993830839
0.423224828517651
-1.7051130142733
0.541981863740972
-0.593027838089475
0.213567450337977
-0.696840242545287
0.0777251570183703
-0.725328497765991
2.1315776363419
-0.33645518676905
-0.979182554450992
-0.242246084610725
-1.82980075345691
-1.14814874978528
0.496126806273696
-0.37803015357093
0.564631359789787
0.268965939275992
0.752661368724124
-2.30203173253409
2.82635859577673
-0.607627712639158
3.77405193258893
1.08426693162876
-2.2508985634727
0.290663952981133
-1.1346060583543
1.41583984485642
0.590041695581542
1.22056539827692
0.0970995178245223
-0.906020145960084
-0.597681226735446
0.437155726246844
0.742487563055592
1.22917286536281
-0.95259160353182
-0.75528682870179


Summary of computational transaction
Raw Input view raw input (R code)
Raw Outputview raw output of R engine
Computing time17 seconds
R ServerBig Analytics Cloud Computing Center

\begin{tabular}{lllllllll}
\hline
Summary of computational transaction \tabularnewline
Raw Input view raw input (R code)  \tabularnewline
Raw Outputview raw output of R engine  \tabularnewline
Computing time17 seconds \tabularnewline
R ServerBig Analytics Cloud Computing Center \tabularnewline
\hline
\end{tabular}
%Source: https://freestatistics.org/blog/index.php?pk=314320&T=0

[TABLE]
[ROW]
Summary of computational transaction[/C][/ROW] [ROW]Raw Input[/C] view raw input (R code) [/C][/ROW] [ROW]Raw Output[/C]view raw output of R engine [/C][/ROW] [ROW]Computing time[/C]17 seconds[/C][/ROW] [ROW]R Server[/C]Big Analytics Cloud Computing Center[/C][/ROW] [/TABLE] Source: https://freestatistics.org/blog/index.php?pk=314320&T=0

Globally Unique Identifier (entire table): ba.freestatistics.org/blog/index.php?pk=314320&T=0

As an alternative you can also use a QR Code:  

The GUIDs for individual cells are displayed in the table below:

Summary of computational transaction
Raw Input view raw input (R code)
Raw Outputview raw output of R engine
Computing time17 seconds
R ServerBig Analytics Cloud Computing Center


Estimation Results of Bootstrap
statisticP1P5Q1EstimateQ3P95P99S.D.IQR
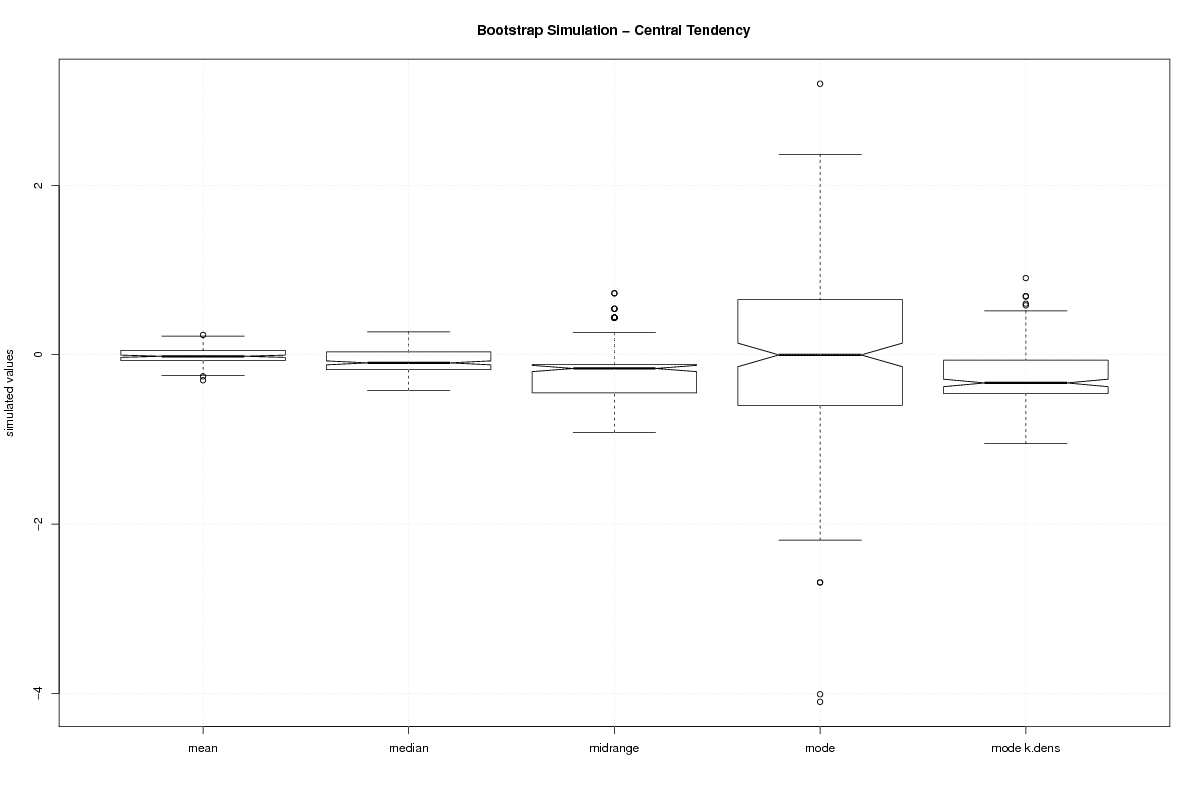
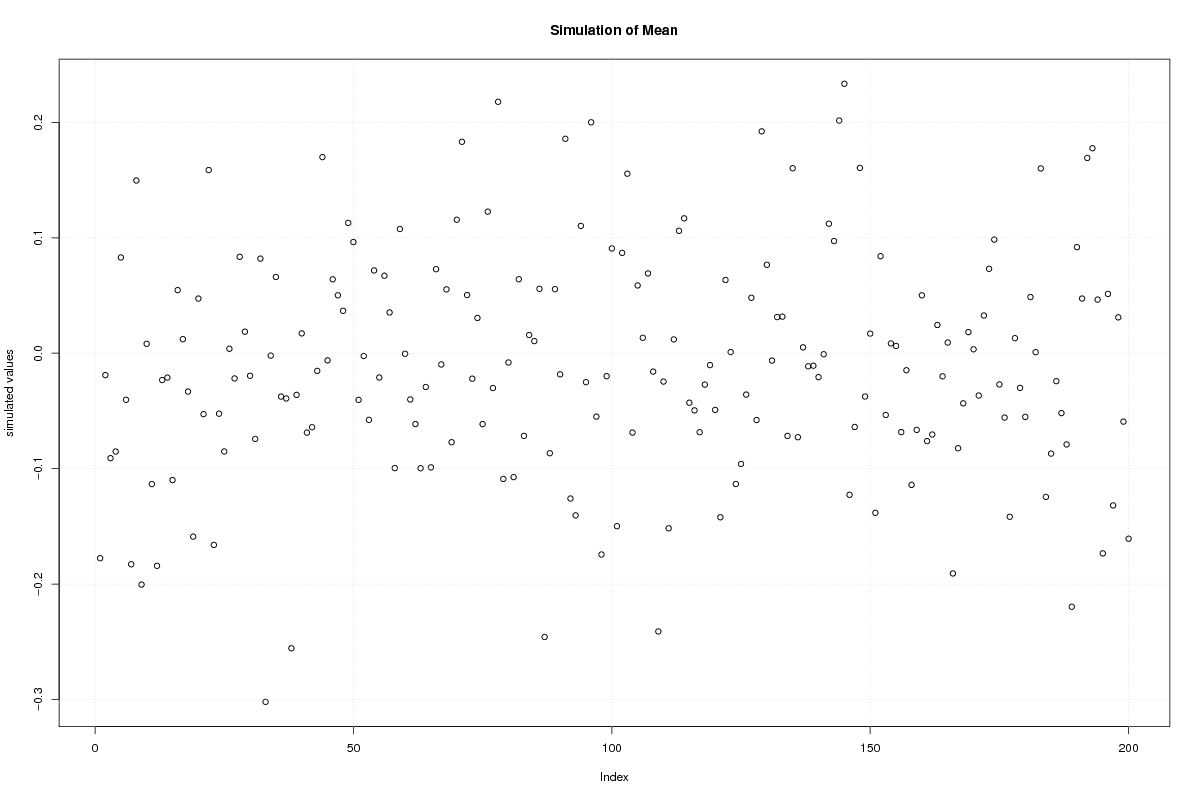
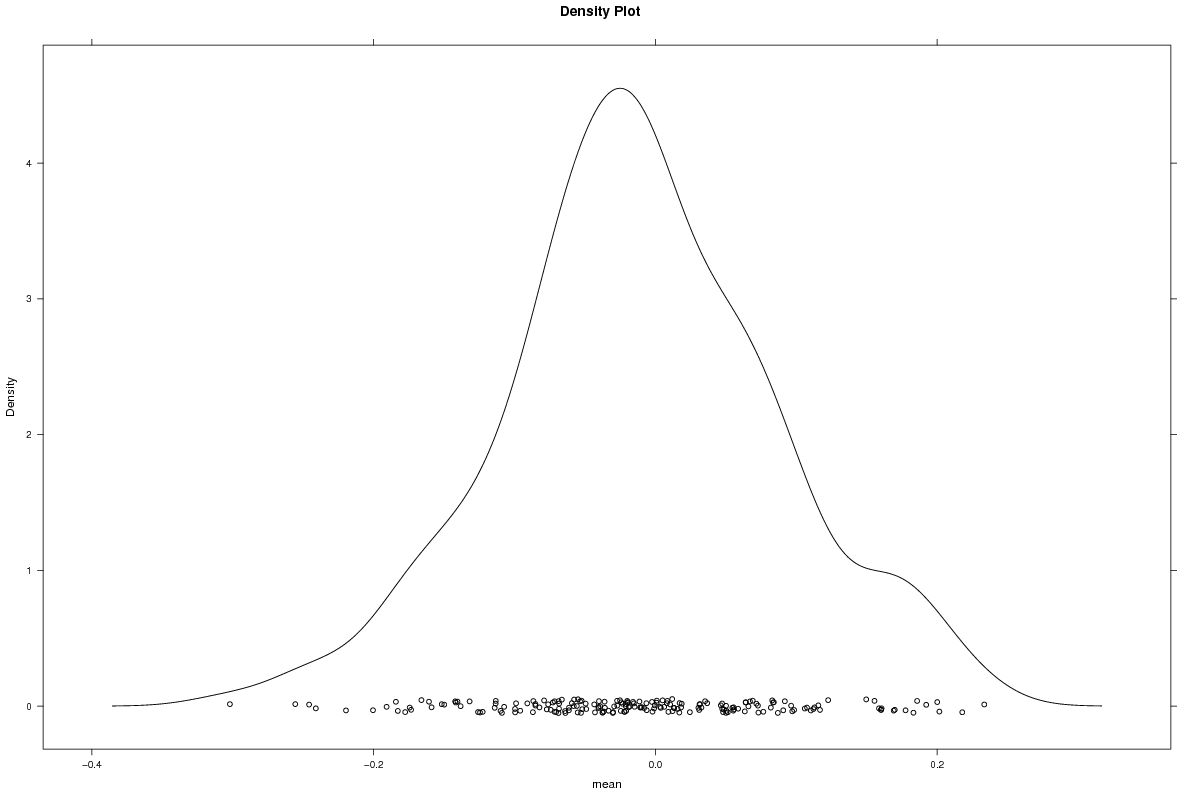
mean-0.24593-0.17457-0.068752-1.9893e-160.0506660.160990.201760.0979580.11942
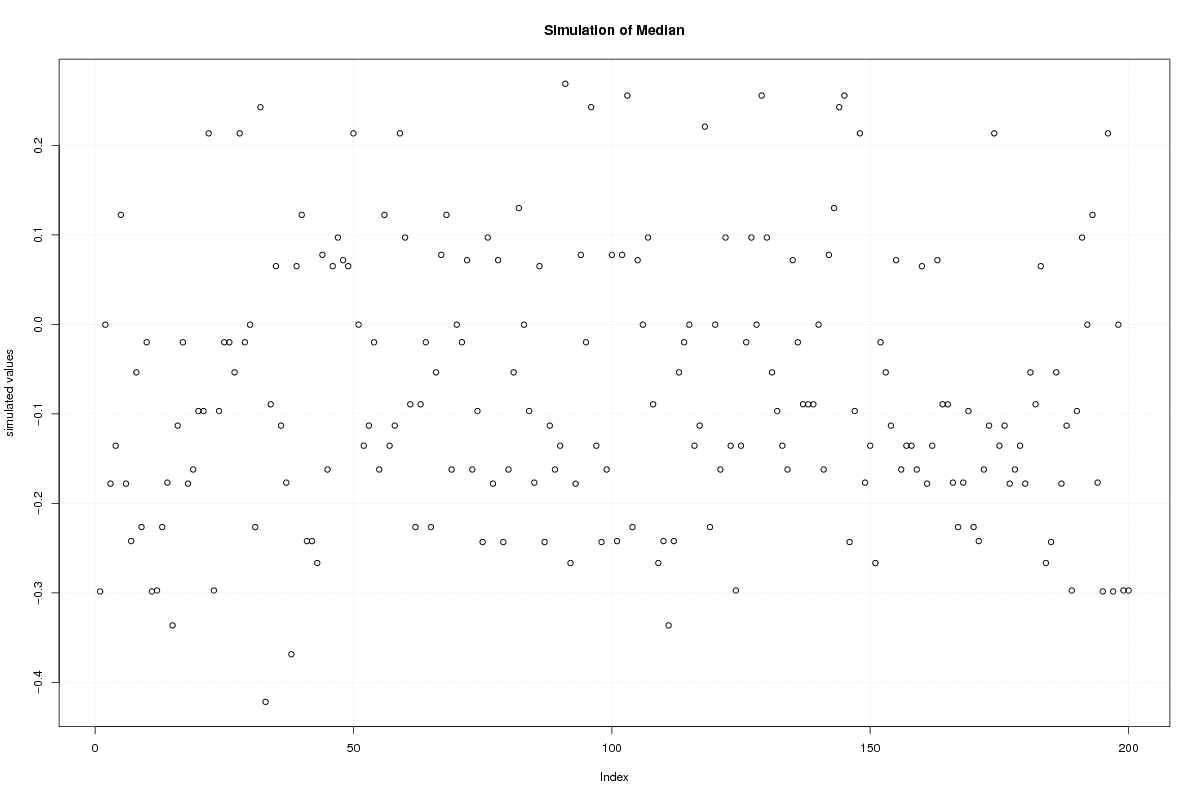
median-0.33678-0.29741-0.17715-0.0893080.0160170.213570.255740.149170.19316
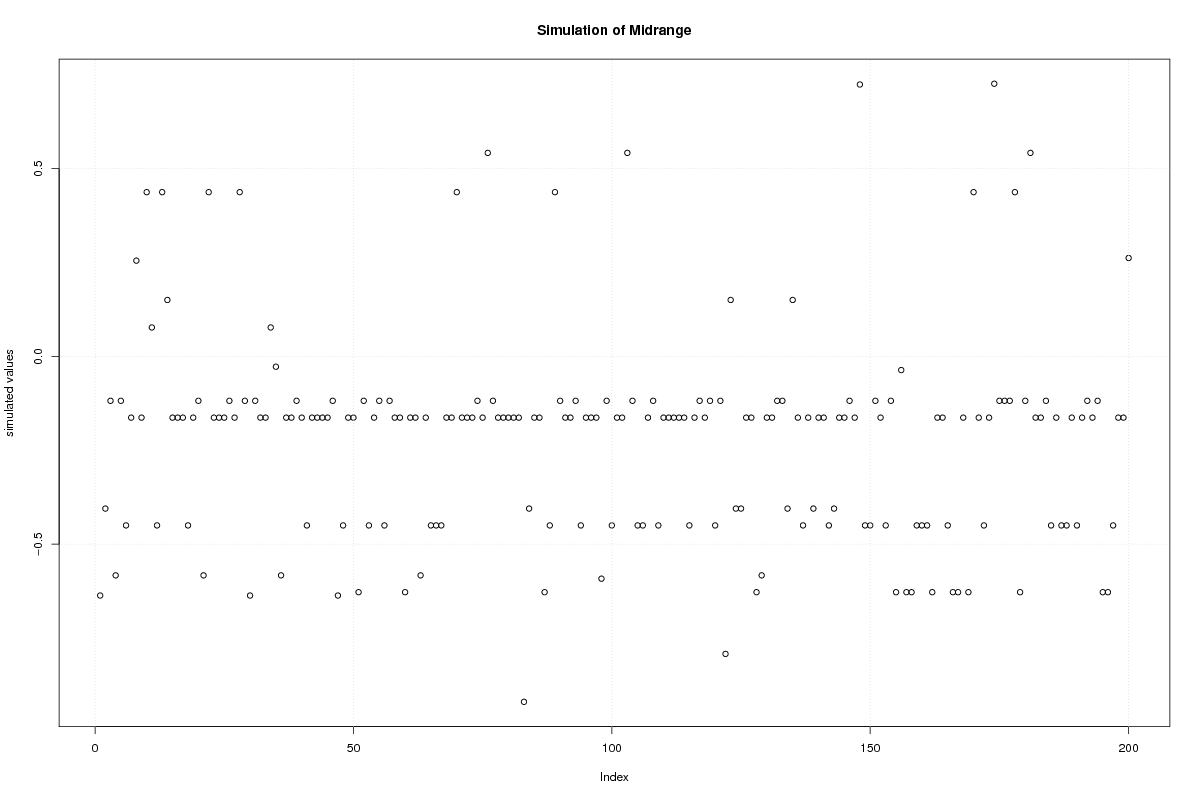
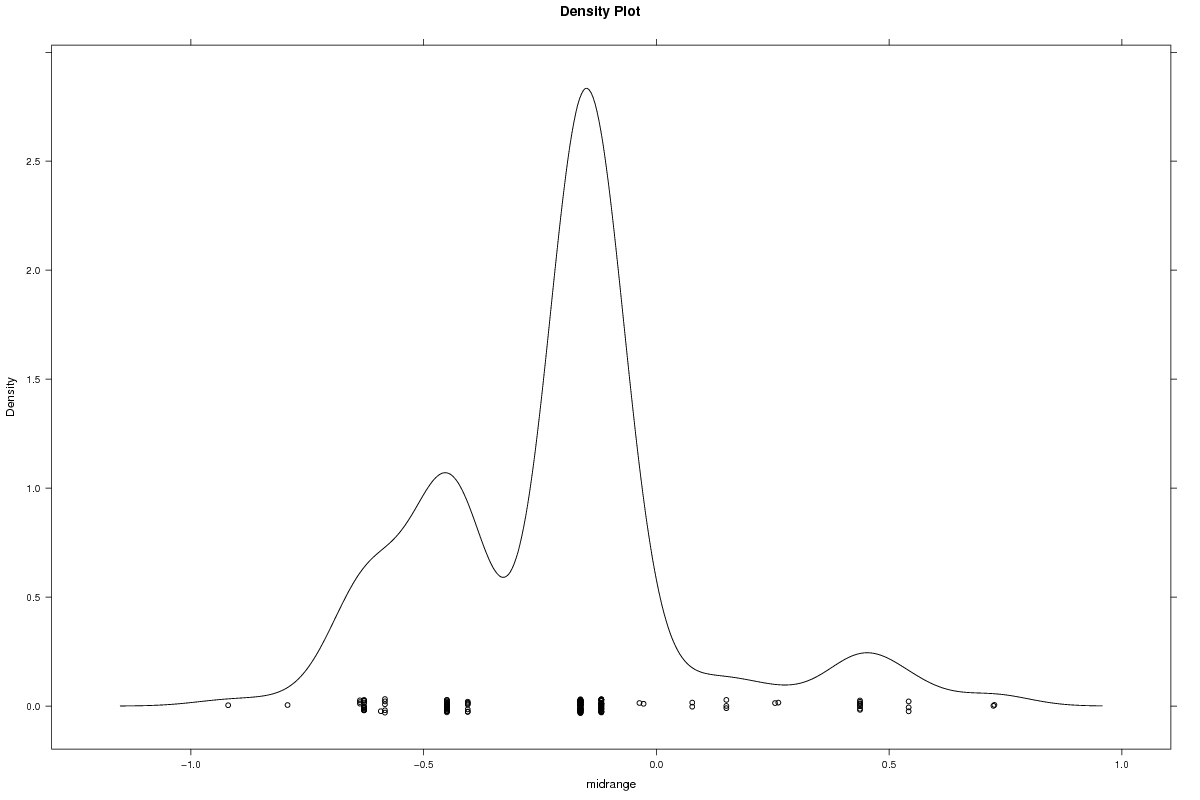
midrange-0.6385-0.62809-0.4502-0.1631-0.118240.437510.543930.2760.33196
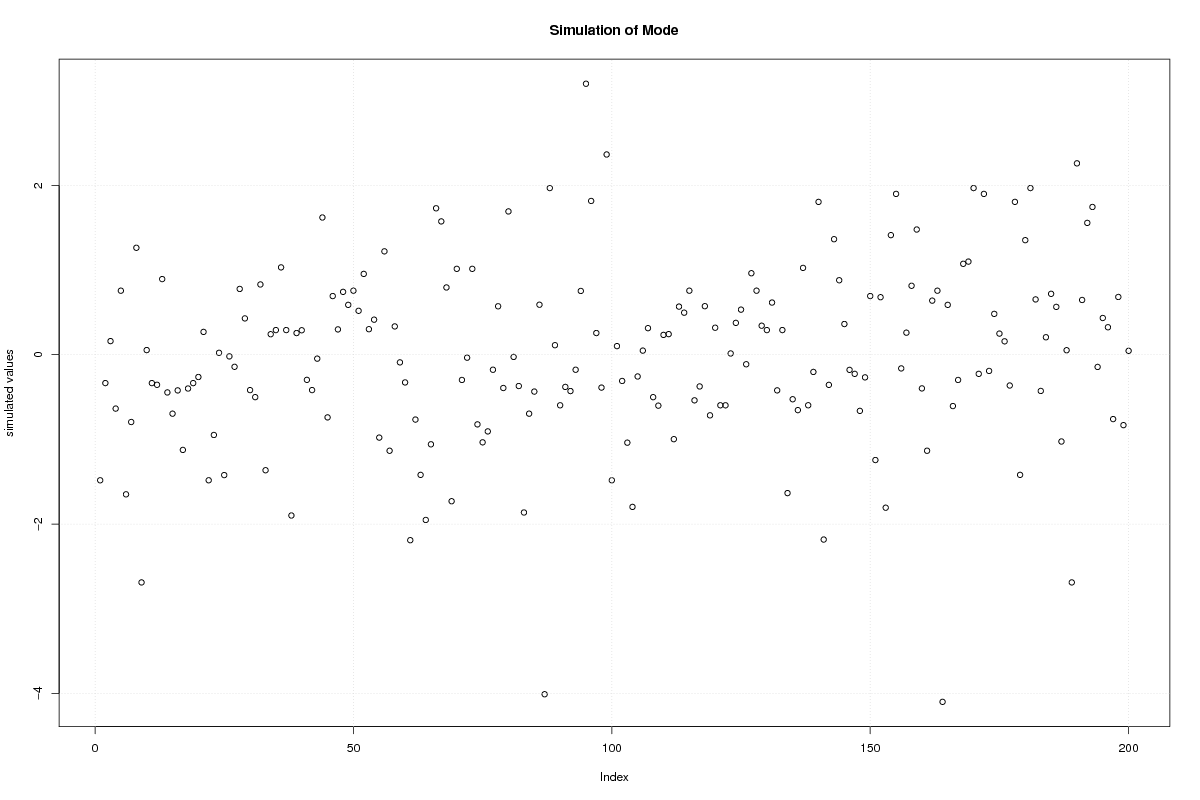
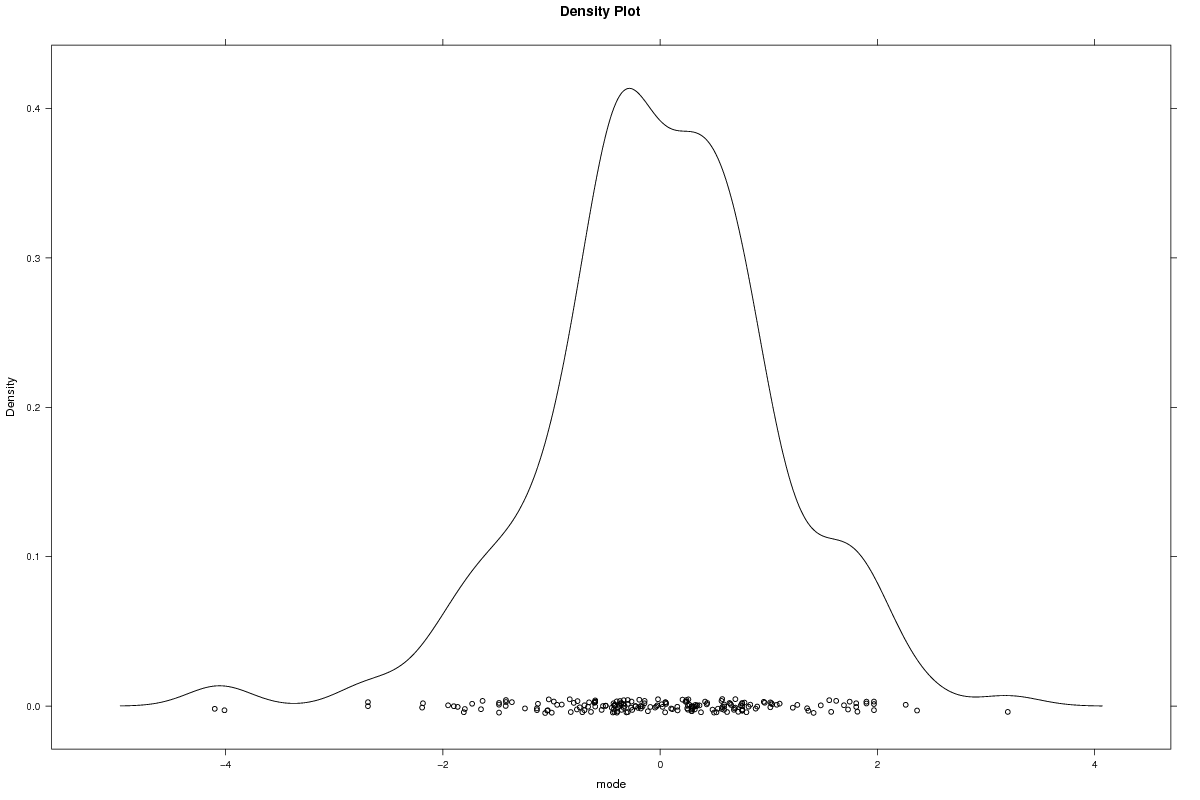
mode-2.703-1.7984-0.59748-1.9786e-160.647661.80462.2611.07041.2451
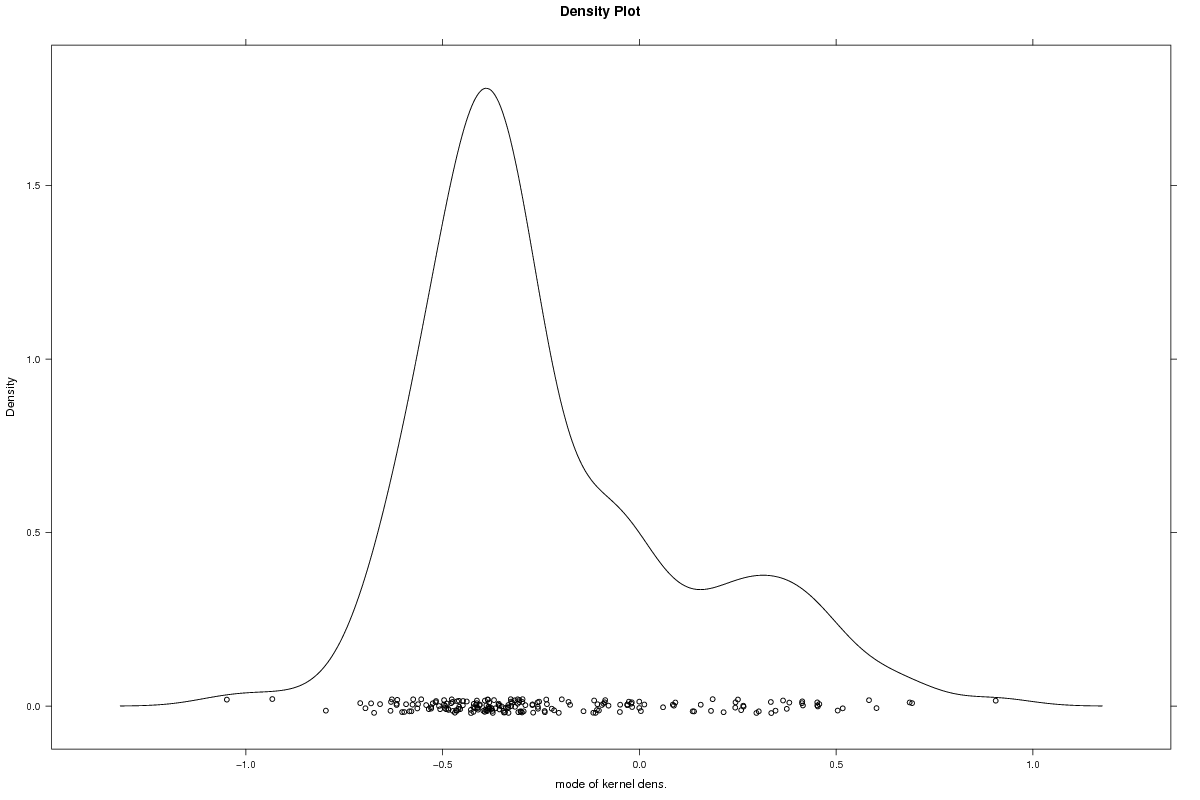
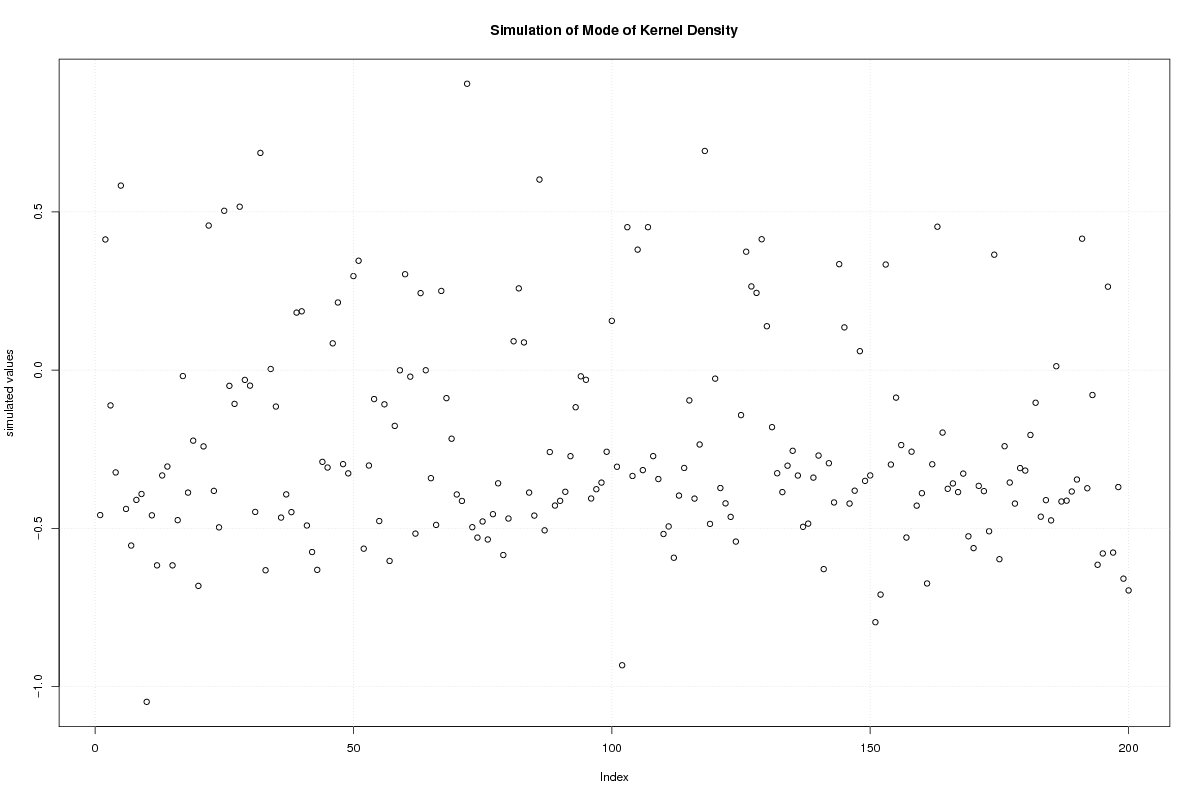
mode k.dens-0.7981-0.62901-0.45902-0.27398-0.071290.451940.686710.337770.38773

\begin{tabular}{lllllllll}
\hline
Estimation Results of Bootstrap \tabularnewline
statistic & P1 & P5 & Q1 & Estimate & Q3 & P95 & P99 & S.D. & IQR \tabularnewline
mean & -0.24593 & -0.17457 & -0.068752 & -1.9893e-16 & 0.050666 & 0.16099 & 0.20176 & 0.097958 & 0.11942 \tabularnewline
median & -0.33678 & -0.29741 & -0.17715 & -0.089308 & 0.016017 & 0.21357 & 0.25574 & 0.14917 & 0.19316 \tabularnewline
midrange & -0.6385 & -0.62809 & -0.4502 & -0.1631 & -0.11824 & 0.43751 & 0.54393 & 0.276 & 0.33196 \tabularnewline
mode & -2.703 & -1.7984 & -0.59748 & -1.9786e-16 & 0.64766 & 1.8046 & 2.261 & 1.0704 & 1.2451 \tabularnewline
mode k.dens & -0.7981 & -0.62901 & -0.45902 & -0.27398 & -0.07129 & 0.45194 & 0.68671 & 0.33777 & 0.38773 \tabularnewline
\hline
\end{tabular}
%Source: https://freestatistics.org/blog/index.php?pk=314320&T=1

[TABLE]
[ROW][C]Estimation Results of Bootstrap[/C][/ROW]
[ROW][C]statistic[/C][C]P1[/C][C]P5[/C][C]Q1[/C][C]Estimate[/C][C]Q3[/C][C]P95[/C][C]P99[/C][C]S.D.[/C][C]IQR[/C][/ROW]
[ROW][C]mean[/C][C]-0.24593[/C][C]-0.17457[/C][C]-0.068752[/C][C]-1.9893e-16[/C][C]0.050666[/C][C]0.16099[/C][C]0.20176[/C][C]0.097958[/C][C]0.11942[/C][/ROW]
[ROW][C]median[/C][C]-0.33678[/C][C]-0.29741[/C][C]-0.17715[/C][C]-0.089308[/C][C]0.016017[/C][C]0.21357[/C][C]0.25574[/C][C]0.14917[/C][C]0.19316[/C][/ROW]
[ROW][C]midrange[/C][C]-0.6385[/C][C]-0.62809[/C][C]-0.4502[/C][C]-0.1631[/C][C]-0.11824[/C][C]0.43751[/C][C]0.54393[/C][C]0.276[/C][C]0.33196[/C][/ROW]
[ROW][C]mode[/C][C]-2.703[/C][C]-1.7984[/C][C]-0.59748[/C][C]-1.9786e-16[/C][C]0.64766[/C][C]1.8046[/C][C]2.261[/C][C]1.0704[/C][C]1.2451[/C][/ROW]
[ROW][C]mode k.dens[/C][C]-0.7981[/C][C]-0.62901[/C][C]-0.45902[/C][C]-0.27398[/C][C]-0.07129[/C][C]0.45194[/C][C]0.68671[/C][C]0.33777[/C][C]0.38773[/C][/ROW]
[/TABLE]
Source: https://freestatistics.org/blog/index.php?pk=314320&T=1

Globally Unique Identifier (entire table): ba.freestatistics.org/blog/index.php?pk=314320&T=1

As an alternative you can also use a QR Code:  

The GUIDs for individual cells are displayed in the table below:

Estimation Results of Bootstrap
statisticP1P5Q1EstimateQ3P95P99S.D.IQR
mean-0.24593-0.17457-0.068752-1.9893e-160.0506660.160990.201760.0979580.11942
median-0.33678-0.29741-0.17715-0.0893080.0160170.213570.255740.149170.19316
midrange-0.6385-0.62809-0.4502-0.1631-0.118240.437510.543930.2760.33196
mode-2.703-1.7984-0.59748-1.9786e-160.647661.80462.2611.07041.2451
mode k.dens-0.7981-0.62901-0.45902-0.27398-0.071290.451940.686710.337770.38773


Parameters (Session):
par1 = 200 ; par2 = 5 ; par3 = 0 ; par4 = P1 P5 Q1 Q3 P95 P99 ;
Parameters (R input):
par1 = 200 ; par2 = 5 ; par3 = 0 ; par4 = P1 P5 Q1 Q3 P95 P99 ;
R code (references can be found in the software module):
par4 <- 'P1 P5 Q1 Q3 P95 P99'
par3 <- '0'
par2 <- '5'
par1 <- '200'
par1 <- as.numeric(par1)
par2 <- as.numeric(par2)
if (par3 == '0') bw <- NULL
if (par3 != '0') bw <- as.numeric(par3)
if (par1 < 10) par1 = 10
if (par1 > 5000) par1 = 5000
library(modeest)
library(lattice)
library(boot)
boot.stat <- function(s,i)
{
s.mean <- mean(s[i])
s.median <- median(s[i])
s.midrange <- (max(s[i]) + min(s[i])) / 2
s.mode <- mlv(s[i], method='mfv')$M
s.kernelmode <- mlv(s[i], method='kernel', bw=bw)$M
c(s.mean, s.median, s.midrange, s.mode, s.kernelmode)
}
x<-na.omit(x)
(r <- boot(x,boot.stat, R=par1, stype='i'))
bitmap(file='plot1.png')
plot(r$t[,1],type='p',ylab='simulated values',main='Simulation of Mean')
grid()
dev.off()
bitmap(file='plot2.png')
plot(r$t[,2],type='p',ylab='simulated values',main='Simulation of Median')
grid()
dev.off()
bitmap(file='plot3.png')
plot(r$t[,3],type='p',ylab='simulated values',main='Simulation of Midrange')
grid()
dev.off()
bitmap(file='plot7.png')
plot(r$t[,4],type='p',ylab='simulated values',main='Simulation of Mode')
grid()
dev.off()
bitmap(file='plot8.png')
plot(r$t[,5],type='p',ylab='simulated values',main='Simulation of Mode of Kernel Density')
grid()
dev.off()
bitmap(file='plot4.png')
densityplot(~r$t[,1],col='black',main='Density Plot',xlab='mean')
dev.off()
bitmap(file='plot5.png')
densityplot(~r$t[,2],col='black',main='Density Plot',xlab='median')
dev.off()
bitmap(file='plot6.png')
densityplot(~r$t[,3],col='black',main='Density Plot',xlab='midrange')
dev.off()
bitmap(file='plot9.png')
densityplot(~r$t[,4],col='black',main='Density Plot',xlab='mode')
dev.off()
bitmap(file='plot10.png')
densityplot(~r$t[,5],col='black',main='Density Plot',xlab='mode of kernel dens.')
dev.off()
z <- data.frame(cbind(r$t[,1],r$t[,2],r$t[,3],r$t[,4],r$t[,5]))
colnames(z) <- list('mean','median','midrange','mode','mode k.dens')
bitmap(file='plot11.png')
boxplot(z,notch=TRUE,ylab='simulated values',main='Bootstrap Simulation - Central Tendency')
grid()
dev.off()
load(file='createtable')
a<-table.start()
a<-table.row.start(a)
a<-table.element(a,'Estimation Results of Bootstrap',10,TRUE)
a<-table.row.end(a)
if (par4 == 'P1 P5 Q1 Q3 P95 P99') {
myq.1 <- 0.01
myq.2 <- 0.05
myq.3 <- 0.95
myq.4 <- 0.99
myl.1 <- 'P1'
myl.2 <- 'P5'
myl.3 <- 'P95'
myl.4 <- 'P99'
}
if (par4 == 'P0.5 P2.5 Q1 Q3 P97.5 P99.5') {
myq.1 <- 0.005
myq.2 <- 0.025
myq.3 <- 0.975
myq.4 <- 0.995
myl.1 <- 'P0.5'
myl.2 <- 'P2.5'
myl.3 <- 'P97.5'
myl.4 <- 'P99.5'
}
if (par4 == 'P10 P20 Q1 Q3 P80 P90') {
myq.1 <- 0.10
myq.2 <- 0.20
myq.3 <- 0.80
myq.4 <- 0.90
myl.1 <- 'P10'
myl.2 <- 'P20'
myl.3 <- 'P80'
myl.4 <- 'P90'
}
a<-table.row.start(a)
a<-table.element(a,'statistic',header=TRUE)
a<-table.element(a,myl.1,header=TRUE)
a<-table.element(a,myl.2,header=TRUE)
a<-table.element(a,'Q1',header=TRUE)
a<-table.element(a,'Estimate',header=TRUE)
a<-table.element(a,'Q3',header=TRUE)
a<-table.element(a,myl.3,header=TRUE)
a<-table.element(a,myl.4,header=TRUE)
a<-table.element(a,'S.D.',header=TRUE)
a<-table.element(a,'IQR',header=TRUE)
a<-table.row.end(a)
a<-table.row.start(a)
a<-table.element(a,'mean',header=TRUE)
q1 <- quantile(r$t[,1],0.25)[[1]]
q3 <- quantile(r$t[,1],0.75)[[1]]
p01 <- quantile(r$t[,1],myq.1)[[1]]
p05 <- quantile(r$t[,1],myq.2)[[1]]
p95 <- quantile(r$t[,1],myq.3)[[1]]
p99 <- quantile(r$t[,1],myq.4)[[1]]
a<-table.element(a,signif(p01,par2))
a<-table.element(a,signif(p05,par2))
a<-table.element(a,signif(q1,par2))
a<-table.element(a,signif(r$t0[1],par2))
a<-table.element(a,signif(q3,par2))
a<-table.element(a,signif(p95,par2))
a<-table.element(a,signif(p99,par2))
a<-table.element( a,signif( sqrt(var(r$t[,1])),par2 ) )
a<-table.element(a,signif(q3-q1,par2))
a<-table.row.end(a)
a<-table.row.start(a)
a<-table.element(a,'median',header=TRUE)
q1 <- quantile(r$t[,2],0.25)[[1]]
q3 <- quantile(r$t[,2],0.75)[[1]]
p01 <- quantile(r$t[,2],myq.1)[[1]]
p05 <- quantile(r$t[,2],myq.2)[[1]]
p95 <- quantile(r$t[,2],myq.3)[[1]]
p99 <- quantile(r$t[,2],myq.4)[[1]]
a<-table.element(a,signif(p01,par2))
a<-table.element(a,signif(p05,par2))
a<-table.element(a,signif(q1,par2))
a<-table.element(a,signif(r$t0[2],par2))
a<-table.element(a,signif(q3,par2))
a<-table.element(a,signif(p95,par2))
a<-table.element(a,signif(p99,par2))
a<-table.element(a,signif(sqrt(var(r$t[,2])),par2))
a<-table.element(a,signif(q3-q1,par2))
a<-table.row.end(a)
a<-table.row.start(a)
a<-table.element(a,'midrange',header=TRUE)
q1 <- quantile(r$t[,3],0.25)[[1]]
q3 <- quantile(r$t[,3],0.75)[[1]]
p01 <- quantile(r$t[,3],myq.1)[[1]]
p05 <- quantile(r$t[,3],myq.2)[[1]]
p95 <- quantile(r$t[,3],myq.3)[[1]]
p99 <- quantile(r$t[,3],myq.4)[[1]]
a<-table.element(a,signif(p01,par2))
a<-table.element(a,signif(p05,par2))
a<-table.element(a,signif(q1,par2))
a<-table.element(a,signif(r$t0[3],par2))
a<-table.element(a,signif(q3,par2))
a<-table.element(a,signif(p95,par2))
a<-table.element(a,signif(p99,par2))
a<-table.element(a,signif(sqrt(var(r$t[,3])),par2))
a<-table.element(a,signif(q3-q1,par2))
a<-table.row.end(a)
a<-table.row.start(a)
a<-table.element(a,'mode',header=TRUE)
q1 <- quantile(r$t[,4],0.25)[[1]]
q3 <- quantile(r$t[,4],0.75)[[1]]
p01 <- quantile(r$t[,4],myq.1)[[1]]
p05 <- quantile(r$t[,4],myq.2)[[1]]
p95 <- quantile(r$t[,4],myq.3)[[1]]
p99 <- quantile(r$t[,4],myq.4)[[1]]
a<-table.element(a,signif(p01,par2))
a<-table.element(a,signif(p05,par2))
a<-table.element(a,signif(q1,par2))
a<-table.element(a,signif(r$t0[4],par2))
a<-table.element(a,signif(q3,par2))
a<-table.element(a,signif(p95,par2))
a<-table.element(a,signif(p99,par2))
a<-table.element(a,signif(sqrt(var(r$t[,4])),par2))
a<-table.element(a,signif(q3-q1,par2))
a<-table.row.end(a)
a<-table.row.start(a)
a<-table.element(a,'mode k.dens',header=TRUE)
q1 <- quantile(r$t[,5],0.25)[[1]]
q3 <- quantile(r$t[,5],0.75)[[1]]
p01 <- quantile(r$t[,5],myq.1)[[1]]
p05 <- quantile(r$t[,5],myq.2)[[1]]
p95 <- quantile(r$t[,5],myq.3)[[1]]
p99 <- quantile(r$t[,5],myq.4)[[1]]
a<-table.element(a,signif(p01,par2))
a<-table.element(a,signif(p05,par2))
a<-table.element(a,signif(q1,par2))
a<-table.element(a,signif(r$t0[5],par2))
a<-table.element(a,signif(q3,par2))
a<-table.element(a,signif(p95,par2))
a<-table.element(a,signif(p99,par2))
a<-table.element(a,signif(sqrt(var(r$t[,5])),par2))
a<-table.element(a,signif(q3-q1,par2))
a<-table.row.end(a)
a<-table.end(a)
table.save(a,file='mytable.tab')