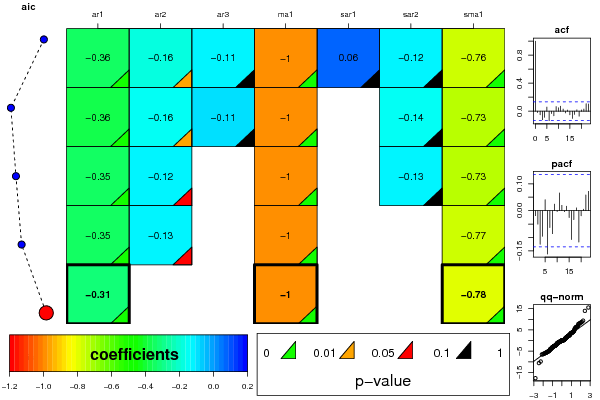
| ARIMA Parameter Estimation and Backward Selection | |||||||
| Iteration | ar1 | ar2 | ar3 | ma1 | sar1 | sar2 | sma1 |
| Estimates ( 1 ) | -0.3562 | -0.1647 | -0.1145 | -0.9998 | 0.0604 | -0.1216 | -0.7643 |
| (p-val) | (0 ) | (0.0295 ) | (0.115 ) | (0 ) | (0.5514 ) | (0.1869 ) | (0 ) |
| Estimates ( 2 ) | -0.3608 | -0.1619 | -0.1075 | -1.0003 | 0 | -0.1407 | -0.7263 |
| (p-val) | (0 ) | (0.0324 ) | (0.1334 ) | (0 ) | (NA ) | (0.1018 ) | (0 ) |
| Estimates ( 3 ) | -0.3465 | -0.1234 | 0 | -1.0002 | 0 | -0.1328 | -0.7278 |
| (p-val) | (0 ) | (0.0838 ) | (NA ) | (0 ) | (NA ) | (0.1238 ) | (0 ) |
| Estimates ( 4 ) | -0.3497 | -0.1282 | 0 | -1.0003 | 0 | 0 | -0.7685 |
| (p-val) | (0 ) | (0.072 ) | (NA ) | (0 ) | (NA ) | (NA ) | (0 ) |
| Estimates ( 5 ) | -0.3068 | 0 | 0 | -1.0002 | 0 | 0 | -0.7806 |
| (p-val) | (0 ) | (NA ) | (NA ) | (0 ) | (NA ) | (NA ) | (0 ) |
| Estimates ( 6 ) | NA | NA | NA | NA | NA | NA | NA |
| (p-val) | (NA ) | (NA ) | (NA ) | (NA ) | (NA ) | (NA ) | (NA ) |
| Estimates ( 7 ) | NA | NA | NA | NA | NA | NA | NA |
| (p-val) | (NA ) | (NA ) | (NA ) | (NA ) | (NA ) | (NA ) | (NA ) |
| Estimates ( 8 ) | NA | NA | NA | NA | NA | NA | NA |
| (p-val) | (NA ) | (NA ) | (NA ) | (NA ) | (NA ) | (NA ) | (NA ) |
| Estimates ( 9 ) | NA | NA | NA | NA | NA | NA | NA |
| (p-val) | (NA ) | (NA ) | (NA ) | (NA ) | (NA ) | (NA ) | (NA ) |
| Estimates ( 10 ) | NA | NA | NA | NA | NA | NA | NA |
| (p-val) | (NA ) | (NA ) | (NA ) | (NA ) | (NA ) | (NA ) | (NA ) |
| Estimates ( 11 ) | NA | NA | NA | NA | NA | NA | NA |
| (p-val) | (NA ) | (NA ) | (NA ) | (NA ) | (NA ) | (NA ) | (NA ) |
| Estimates ( 12 ) | NA | NA | NA | NA | NA | NA | NA |
| (p-val) | (NA ) | (NA ) | (NA ) | (NA ) | (NA ) | (NA ) | (NA ) |
| Estimates ( 13 ) | NA | NA | NA | NA | NA | NA | NA |
| (p-val) | (NA ) | (NA ) | (NA ) | (NA ) | (NA ) | (NA ) | (NA ) |
| Menu of Residual Diagnostics | |
| Description | Link |
| Histogram | Compute |
| Central Tendency | Compute |
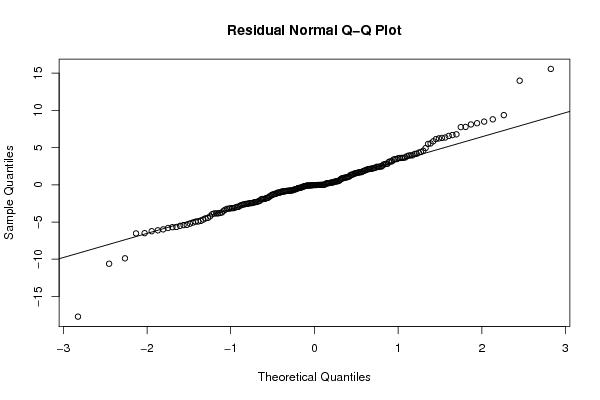
| QQ Plot | Compute |
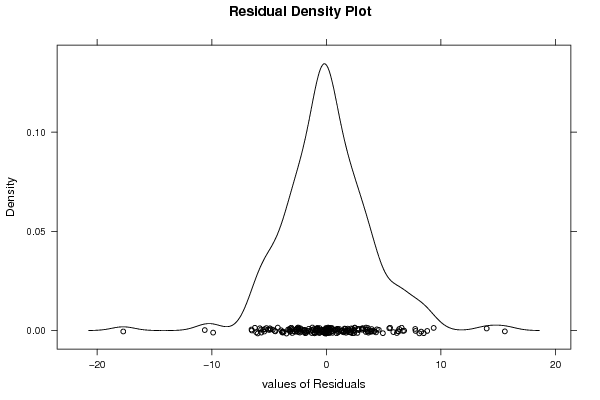
| Kernel Density Plot | Compute |
| Skewness/Kurtosis Test | Compute |
| Skewness-Kurtosis Plot | Compute |
| Harrell-Davis Plot | Compute |
| Bootstrap Plot -- Central Tendency | Compute |
| Blocked Bootstrap Plot -- Central Tendency | Compute |
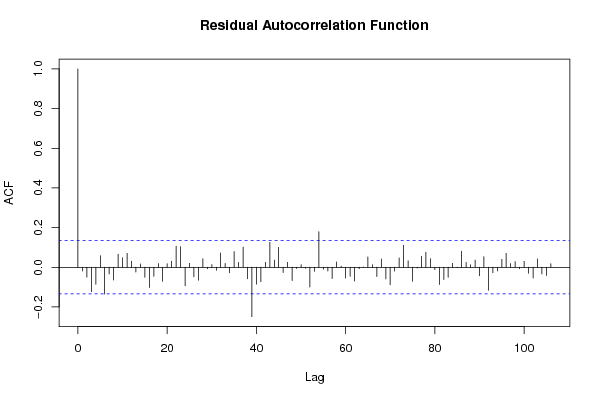
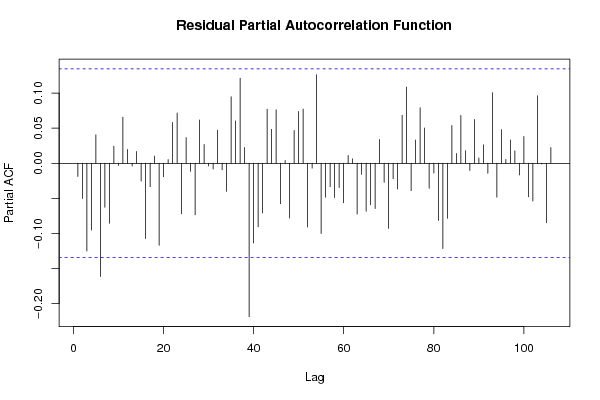
| (Partial) Autocorrelation Plot | Compute |
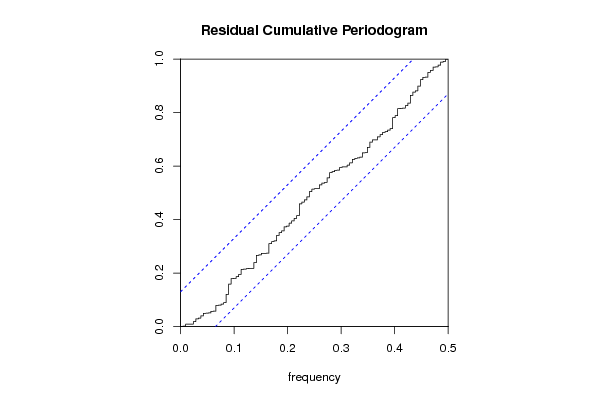
| Spectral Analysis | Compute |
| Tukey lambda PPCC Plot | Compute |
| Box-Cox Normality Plot | Compute |
| Summary Statistics | Compute |