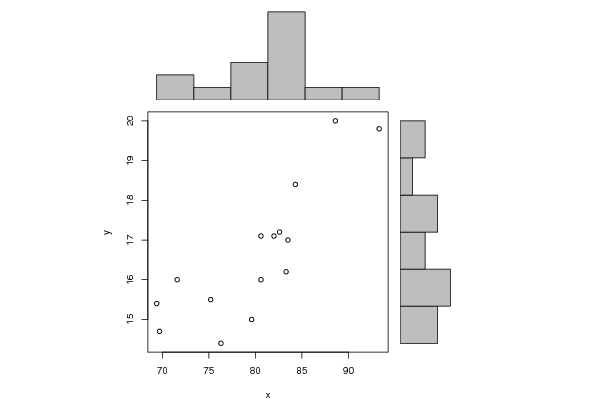
| Pearson Product Moment Correlation - Ungrouped Data | ||
| Statistic | Variable X | Variable Y |
| Mean | 80.04 | 16.6533333333333 |
| Biased Variance | 41.9890666666666 | 2.70382222222222 |
| Biased Standard Deviation | 6.47989711852485 | 1.64433032637065 |
| Covariance | 9.53414285714286 | |
| Correlation | 0.835143786782374 | |
| Determination | 0.697465144601204 | |
| T-Test | 5.47450960243449 | |
| p-value (2 sided) | 0.000106671855974303 | |
| p-value (1 sided) | 5.33359279871513e-05 | |
| 95% CI of Correlation | [0.56429282201005, 0.94368555742217] | |
| Degrees of Freedom | 13 | |
| Number of Observations | 15 | |
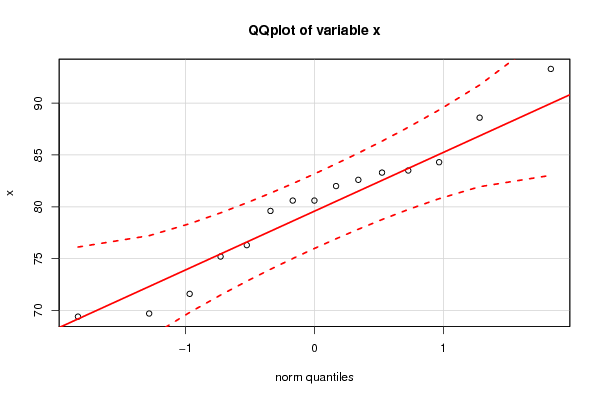
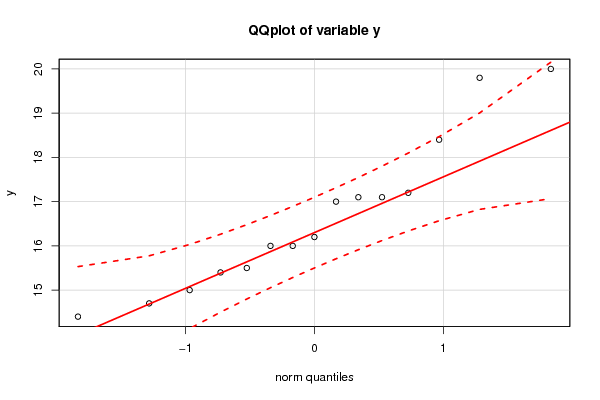
| Normality Tests |
> jarque.x Jarque-Bera Normality Test data: x JB = 0.13672, p-value = 0.9339 alternative hypothesis: greater |
> jarque.y Jarque-Bera Normality Test data: y JB = 1.3289, p-value = 0.5146 alternative hypothesis: greater |
> ad.x Anderson-Darling normality test data: x A = 0.30834, p-value = 0.5197 |
> ad.y Anderson-Darling normality test data: y A = 0.44083, p-value = 0.2508 |