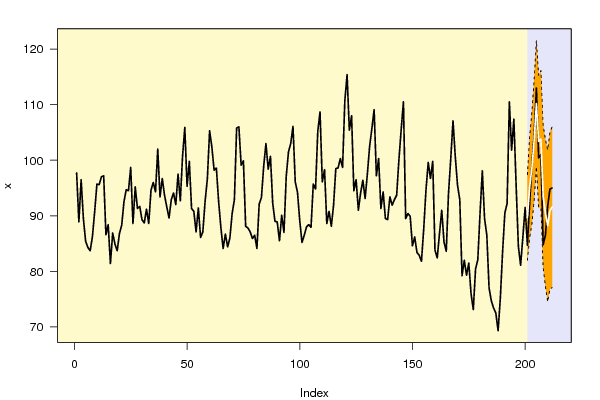
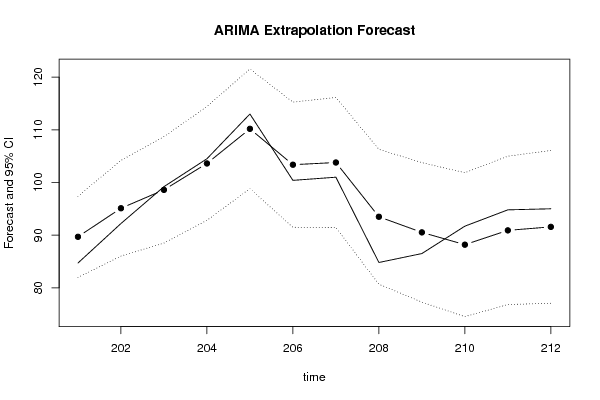
| Univariate ARIMA Extrapolation Forecast | ||||||||
| time | Y[t] | F[t] | 95% LB | 95% UB | p-value (H0: Y[t] = F[t]) | P(F[t]>Y[t-1]) | P(F[t]>Y[t-s]) | P(F[t]>Y[200]) |
| 188 | 69.3 | - | - | - | - | - | - | - |
| 189 | 75.2 | - | - | - | - | - | - | - |
| 190 | 83.5 | - | - | - | - | - | - | - |
| 191 | 90.5 | - | - | - | - | - | - | - |
| 192 | 92.2 | - | - | - | - | - | - | - |
| 193 | 110.5 | - | - | - | - | - | - | - |
| 194 | 101.8 | - | - | - | - | - | - | - |
| 195 | 107.4 | - | - | - | - | - | - | - |
| 196 | 95.5 | - | - | - | - | - | - | - |
| 197 | 84.5 | - | - | - | - | - | - | - |
| 198 | 81.1 | - | - | - | - | - | - | - |
| 199 | 86.2 | - | - | - | - | - | - | - |
| 200 | 91.5 | - | - | - | - | - | - | - |
| 201 | 84.7 | 89.6816 | 81.9788 | 97.3844 | 0.1025 | 0.3218 | 0.9999 | 0.3218 |
| 202 | 92.2 | 95.1007 | 86.0182 | 104.1832 | 0.2657 | 0.9876 | 0.9939 | 0.7814 |
| 203 | 99.2 | 98.5924 | 88.4878 | 108.697 | 0.4531 | 0.8925 | 0.9418 | 0.9155 |
| 204 | 104.5 | 103.6102 | 92.8156 | 114.4048 | 0.4358 | 0.7884 | 0.9809 | 0.9861 |
| 205 | 113 | 110.1867 | 98.8168 | 121.5566 | 0.3138 | 0.8365 | 0.4785 | 0.9994 |
| 206 | 100.4 | 103.3719 | 91.4931 | 115.2508 | 0.3119 | 0.0561 | 0.6023 | 0.9749 |
| 207 | 101 | 103.7906 | 91.4381 | 116.1432 | 0.329 | 0.7047 | 0.2834 | 0.9744 |
| 208 | 84.8 | 93.4877 | 80.6834 | 106.292 | 0.0918 | 0.1251 | 0.379 | 0.6195 |
| 209 | 86.5 | 90.5224 | 77.2805 | 103.7643 | 0.2758 | 0.8015 | 0.8136 | 0.4425 |
| 210 | 91.7 | 88.186 | 74.5167 | 101.8553 | 0.3072 | 0.5955 | 0.8452 | 0.3173 |
| 211 | 94.8 | 90.9028 | 76.8139 | 104.9917 | 0.2939 | 0.4558 | 0.7435 | 0.4669 |
| 212 | 95 | 91.5657 | 77.0637 | 106.0677 | 0.3213 | 0.331 | 0.5035 | 0.5035 |
| Univariate ARIMA Extrapolation Forecast Performance | |||||||||
| time | % S.E. | PE | MAPE | sMAPE | Sq.E | MSE | RMSE | ScaledE | MASE |
| 201 | 0.0438 | -0.0588 | 0.0588 | 0.0571 | 24.8165 | 0 | 0 | -0.807 | 0.807 |
| 202 | 0.0487 | -0.0315 | 0.0451 | 0.0441 | 8.4142 | 16.6154 | 4.0762 | -0.4699 | 0.6385 |
| 203 | 0.0523 | 0.0061 | 0.0321 | 0.0314 | 0.3691 | 11.2 | 3.3466 | 0.0984 | 0.4585 |
| 204 | 0.0532 | 0.0085 | 0.0262 | 0.0257 | 0.7917 | 8.5979 | 2.9322 | 0.1441 | 0.3799 |
| 205 | 0.0526 | 0.0249 | 0.026 | 0.0256 | 7.9146 | 8.4612 | 2.9088 | 0.4558 | 0.3951 |
| 206 | 0.0586 | -0.0296 | 0.0266 | 0.0262 | 8.8323 | 8.5231 | 2.9194 | -0.4815 | 0.4095 |
| 207 | 0.0607 | -0.0276 | 0.0267 | 0.0263 | 7.7877 | 8.418 | 2.9014 | -0.4521 | 0.4156 |
| 208 | 0.0699 | -0.1024 | 0.0362 | 0.0352 | 75.4757 | 16.8002 | 4.0988 | -1.4074 | 0.5395 |
| 209 | 0.0746 | -0.0465 | 0.0373 | 0.0364 | 16.18 | 16.7313 | 4.0904 | -0.6516 | 0.552 |
| 210 | 0.0791 | 0.0383 | 0.0374 | 0.0366 | 12.3482 | 16.293 | 4.0365 | 0.5693 | 0.5537 |
| 211 | 0.0791 | 0.0411 | 0.0378 | 0.0371 | 15.188 | 16.1925 | 4.024 | 0.6314 | 0.5608 |
| 212 | 0.0808 | 0.0362 | 0.0376 | 0.0371 | 11.7943 | 15.826 | 3.9782 | 0.5564 | 0.5604 |