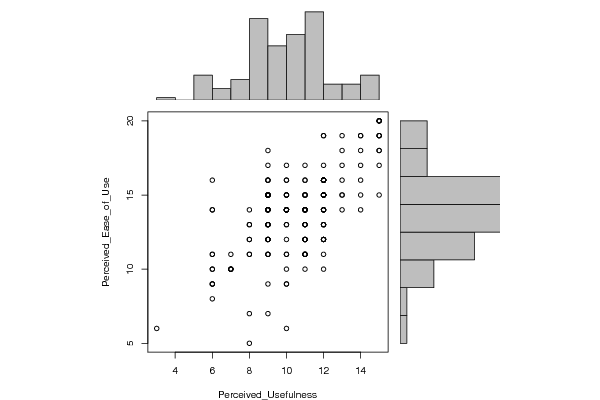
| Pearson Product Moment Correlation - Ungrouped Data | ||
| Statistic | Variable X | Variable Y |
| Mean | 10.5083798882682 | 13.8212290502793 |
| Biased Variance | 5.19965044786367 | 8.16915826597172 |
| Biased Standard Deviation | 2.28027420453411 | 2.85817393906874 |
| Covariance | 4.18128177766619 | |
| Correlation | 0.637970618250505 | |
| Determination | 0.407006509750931 | |
| T-Test | 11.0220492693349 | |
| p-value (2 sided) | 7.65581088187246e-22 | |
| p-value (1 sided) | 3.82790544093623e-22 | |
| 95% CI of Correlation | [0.54201620612425, 0.71750416481237] | |
| Degrees of Freedom | 177 | |
| Number of Observations | 179 | |
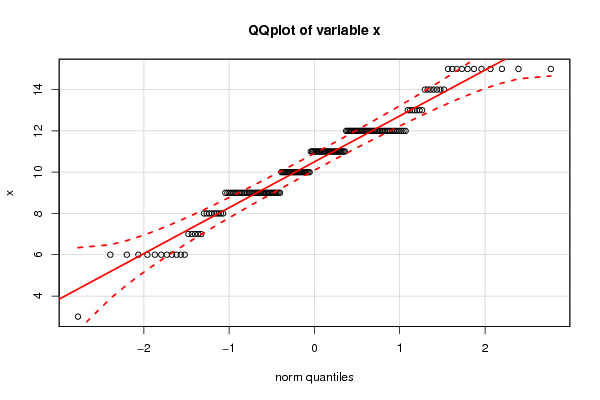
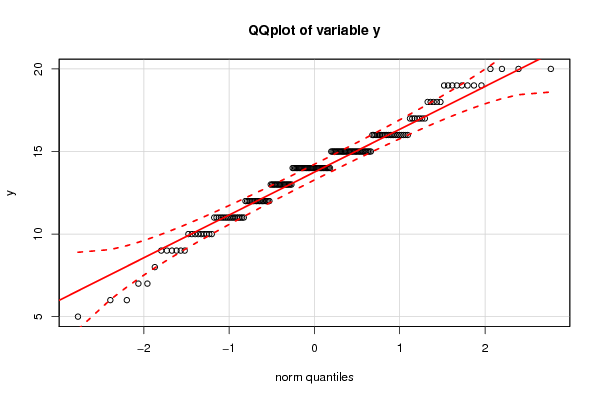
| Normality Tests |
> jarque.x Jarque-Bera Normality Test data: x JB = 1.0324, p-value = 0.5968 alternative hypothesis: greater |
> jarque.y Jarque-Bera Normality Test data: y JB = 3.2929, p-value = 0.1927 alternative hypothesis: greater |
> ad.x Anderson-Darling normality test data: x A = 2.4712, p-value = 2.874e-06 |
> ad.y Anderson-Darling normality test data: y A = 1.6909, p-value = 0.0002371 |