Free Statistics
of Irreproducible Research!
Description of Statistical Computation | ||||||||||||||||||||||||||||||||||||||||||||||||
|---|---|---|---|---|---|---|---|---|---|---|---|---|---|---|---|---|---|---|---|---|---|---|---|---|---|---|---|---|---|---|---|---|---|---|---|---|---|---|---|---|---|---|---|---|---|---|---|---|
| Author's title | ||||||||||||||||||||||||||||||||||||||||||||||||
| Author | *The author of this computation has been verified* | |||||||||||||||||||||||||||||||||||||||||||||||
| R Software Module | rwasp_fitdistrnorm.wasp | |||||||||||||||||||||||||||||||||||||||||||||||
| Title produced by software | ML Fitting and QQ Plot- Normal Distribution | |||||||||||||||||||||||||||||||||||||||||||||||
| Date of computation | Thu, 01 Feb 2018 09:40:32 +0100 | |||||||||||||||||||||||||||||||||||||||||||||||
| Cite this page as follows | Statistical Computations at FreeStatistics.org, Office for Research Development and Education, URL https://freestatistics.org/blog/index.php?v=date/2018/Feb/01/t1517474448dal2w9d3t4aad6c.htm/, Retrieved Mon, 29 Apr 2024 05:47:46 +0000 | |||||||||||||||||||||||||||||||||||||||||||||||
| Statistical Computations at FreeStatistics.org, Office for Research Development and Education, URL https://freestatistics.org/blog/index.php?pk=313728, Retrieved Mon, 29 Apr 2024 05:47:46 +0000 | ||||||||||||||||||||||||||||||||||||||||||||||||
| QR Codes: | ||||||||||||||||||||||||||||||||||||||||||||||||
|
| ||||||||||||||||||||||||||||||||||||||||||||||||
| Original text written by user: | ||||||||||||||||||||||||||||||||||||||||||||||||
| IsPrivate? | No (this computation is public) | |||||||||||||||||||||||||||||||||||||||||||||||
| User-defined keywords | ||||||||||||||||||||||||||||||||||||||||||||||||
| Estimated Impact | 62 | |||||||||||||||||||||||||||||||||||||||||||||||
Tree of Dependent Computations | ||||||||||||||||||||||||||||||||||||||||||||||||
| Family? (F = Feedback message, R = changed R code, M = changed R Module, P = changed Parameters, D = changed Data) | ||||||||||||||||||||||||||||||||||||||||||||||||
| - [ML Fitting and QQ Plot- Normal Distribution] [] [2018-02-01 08:40:32] [32118082f2c8d57cb544554523dbaf9e] [Current] | ||||||||||||||||||||||||||||||||||||||||||||||||
| Feedback Forum | ||||||||||||||||||||||||||||||||||||||||||||||||
Post a new message | ||||||||||||||||||||||||||||||||||||||||||||||||
Dataset | ||||||||||||||||||||||||||||||||||||||||||||||||
| Dataseries X: | ||||||||||||||||||||||||||||||||||||||||||||||||
1.43654201751303 -2.10834848785855 1.40062961321576 3.40062961321576 -1.54550178033834 -0.144260892155814 -0.126304690007183 0.364717208918502 -2.56345798248697 0.891651512141449 -1.61732658893287 -0.581414184635604 1.90960771429008 -1.56345798248697 -0.599370386784235 -0.108348487858551 1.34676100676987 1.94552011858734 2.4185858153644 -0.0903922857099194 0.382673411067133 1.4185858153644 0.400629613215765 0.891651512141449 1.85573910784419 0.382673411067133 -0.617326588932867 -1.59937038678424 0.400629613215765 0.400629613215765 -1.09039228570992 2.3647172089185 0.891651512141449 -2.10834848785855 0.891651512141449 1.90960771429008 -1.59937038678424 -2.10834848785855 0.400629613215765 -1.14426089215581 0.382673411067133 0.382673411067133 2.4185858153644 -2.56345798248697 1.92756391643871 1.90960771429008 -1.59937038678424 1.92756391643871 -0.0724360835612879 -1.61732658893287 1.94552011858734 -2.61732658893287 -1.14426089215581 0.90960771429008 -2.10834848785855 -1.59937038678424 0.891651512141449 -3.07243608356129 -0.599370386784235 0.891651512141449 -1.12630469000718 2.38267341106713 -2.09039228570992 -2.10834848785855 -0.599370386784235 -1.10834848785855 -0.599370386784235 1.4185858153644 0.418585815364396 0.891651512141449 1.87369530999282 -0.0903922857099194 1.98143252288461 0.963476320735975 -1.56345798248697 -0.108348487858551 -2.05447988141266 0.945520118587343 0.891651512141449 1.40062961321576 2.92756391643871 -3.6352827910815 1.34676100676987 1.34676100676987 1.38267341106713 -2.10834848785855 1.40062961321576 -1.09039228570992 2.3647172089185 0.400629613215765 1.4185858153644 -2.05447988141266 0.855739107844186 0.90960771429008 -1.5814141846356 -0.599370386784235 3.47245442181029 -1.59937038678424 -1.07243608356129 -0.0724360835612879 -0.599370386784235 1.4185858153644 0.855739107844186 1.90960771429008 -1.59937038678424 0.873695309992817 -1.5814141846356 0.382673411067133 2.89165151214145 -2.10834848785855 -1.10834848785855 0.382673411067133 0.891651512141449 -0.581414184635604 -1.09039228570992 1.40062961321576 2.87369530999282 1.40062961321576 0.400629613215765 -2.59937038678424 -0.108348487858551 1.92756391643871 0.927563916438712 0.382673411067133 -0.581414184635604 1.4185858153644 1.85573910784419 1.3647172089185 -5.61732658893287 -2.61732658893287 -1.09039228570992 -1.07243608356129 -1.56345798248697 -0.599370386784235 -4.59937038678424 -1.59937038678424 -2.61732658893287 -1.56345798248697 -0.617326588932867 1.96347632073598 0.382673411067133 -2.10834848785855 -2.12630469000718 1.92756391643871 -2.07243608356129 3.43654201751303 -2.09039228570992 2.40062961321576 0.90960771429008 0.90960771429008 2.4185858153644 2.43654201751303 0.891651512141449 -3.52754557818971 -1.10834848785855 1.89165151214145 0.927563916438712 -4.59937038678424 0.400629613215765 0.382673411067133 -0.581414184635604 -1.10834848785855 1.34676100676987 -0.581414184635604 -2.05447988141266 -1.09039228570992 3.89165151214145 1.85573910784419 -0.0724360835612879 1.92756391643871 -3.12630469000718 -0.108348487858551 -0.599370386784235 -2.10834848785855 -3.07243608356129 2.4185858153644 1.89165151214145 0.382673411067133 0.382673411067133 | ||||||||||||||||||||||||||||||||||||||||||||||||
Tables (Output of Computation) | ||||||||||||||||||||||||||||||||||||||||||||||||
| ||||||||||||||||||||||||||||||||||||||||||||||||
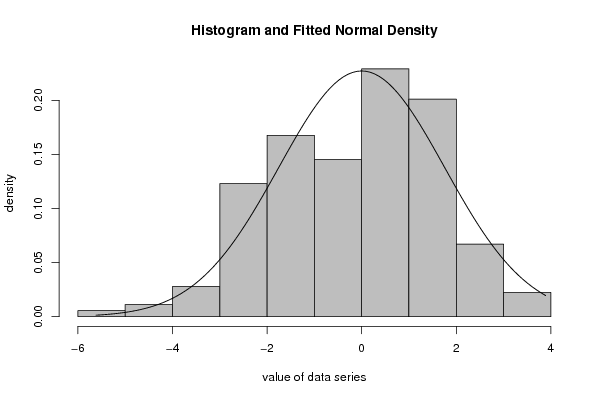
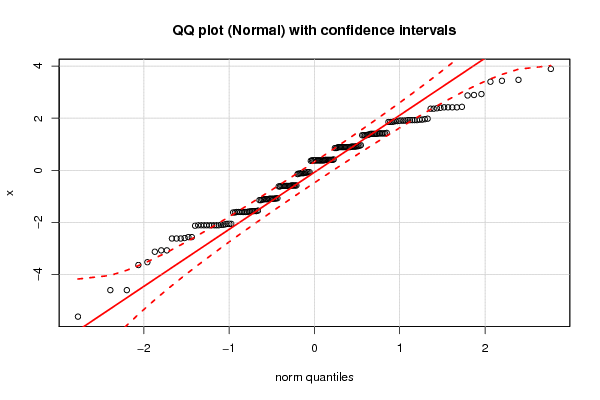
Figures (Output of Computation) | ||||||||||||||||||||||||||||||||||||||||||||||||
Input Parameters & R Code | ||||||||||||||||||||||||||||||||||||||||||||||||
| Parameters (Session): | ||||||||||||||||||||||||||||||||||||||||||||||||
| Parameters (R input): | ||||||||||||||||||||||||||||||||||||||||||||||||
| par1 = 8 ; par2 = 0 ; | ||||||||||||||||||||||||||||||||||||||||||||||||
| R code (references can be found in the software module): | ||||||||||||||||||||||||||||||||||||||||||||||||
library(MASS) | ||||||||||||||||||||||||||||||||||||||||||||||||