| Tabulation of Results | ||
| spssC x groupC | ||
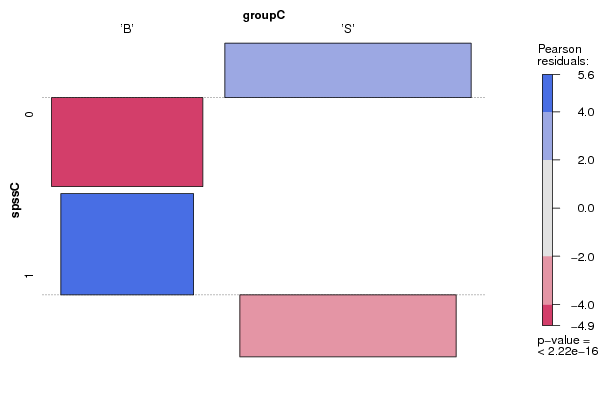
| 'B' | 'S' | 0 | 2 | 99 | 1 | 47 | 31 |
| Tabulation of Expected Results | ||
| spssC x groupC | ||
| 'B' | 'S' | 0 | 27.65 | 73.35 | 1 | 21.35 | 56.65 |
| Statistical Results | |
| Pearson's Chi-squared test with Yates' continuity correction | |
| Pearson Chi Square Statistic | 72.28 |
| Degrees of Freedom | 1 |
| P value | 0 |