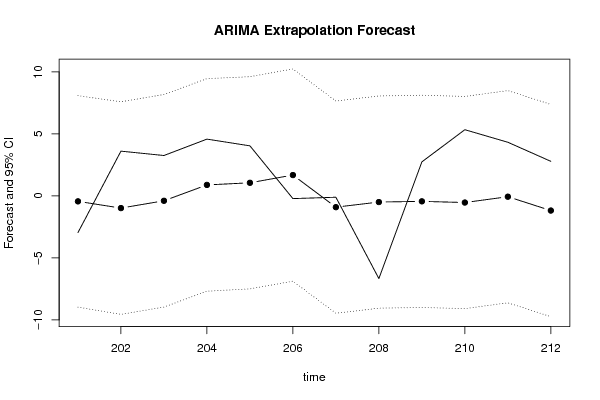
| Univariate ARIMA Extrapolation Forecast | ||||||||
| time | Y[t] | F[t] | 95% LB | 95% UB | p-value (H0: Y[t] = F[t]) | P(F[t]>Y[t-1]) | P(F[t]>Y[t-s]) | P(F[t]>Y[200]) |
| 188 | -9.53894275797437 | - | - | - | - | - | - | - |
| 189 | -2.52198658144077 | - | - | - | - | - | - | - |
| 190 | -3.74119764281139 | - | - | - | - | - | - | - |
| 191 | 2.19669722197803 | - | - | - | - | - | - | - |
| 192 | -5.76158272034317 | - | - | - | - | - | - | - |
| 193 | 11.5282655390469 | - | - | - | - | - | - | - |
| 194 | 1.77267041237508 | - | - | - | - | - | - | - |
| 195 | 12.6725222840074 | - | - | - | - | - | - | - |
| 196 | 3.46546572748846 | - | - | - | - | - | - | - |
| 197 | -1.0804696213614 | - | - | - | - | - | - | - |
| 198 | -0.306116395111087 | - | - | - | - | - | - | - |
| 199 | 3.86481926030857 | - | - | - | - | - | - | - |
| 200 | 7.42235826762557 | - | - | - | - | - | - | - |
| 201 | -2.9527 | -0.4346 | -8.9615 | 8.0923 | 0.2814 | 0.0355 | 0.6843 | 0.0355 |
| 202 | 3.6147 | -0.9762 | -9.5484 | 7.5959 | 0.1469 | 0.6743 | 0.7364 | 0.0274 |
| 203 | 3.2632 | -0.3868 | -8.959 | 8.1853 | 0.202 | 0.1801 | 0.2774 | 0.0371 |
| 204 | 4.5849 | 0.8912 | -7.6808 | 9.4632 | 0.1992 | 0.2938 | 0.9359 | 0.0677 |
| 205 | 4.0433 | 1.063 | -7.4942 | 9.6203 | 0.2474 | 0.2099 | 0.0083 | 0.0726 |
| 206 | -0.2121 | 1.6872 | -6.8701 | 10.2444 | 0.3318 | 0.2947 | 0.4922 | 0.0945 |
| 207 | -0.1014 | -0.9025 | -9.4597 | 7.6548 | 0.4272 | 0.4372 | 9e-04 | 0.0283 |
| 208 | -6.6612 | -0.4902 | -9.0475 | 8.0671 | 0.0788 | 0.4645 | 0.1825 | 0.035 |
| 209 | 2.7483 | -0.4335 | -8.9908 | 8.1237 | 0.2331 | 0.9231 | 0.5589 | 0.036 |
| 210 | 5.3451 | -0.5295 | -9.0868 | 8.0277 | 0.0892 | 0.2264 | 0.4796 | 0.0343 |
| 211 | 4.3318 | -0.0586 | -8.6159 | 8.4986 | 0.1573 | 0.1079 | 0.1844 | 0.0433 |
| 212 | 2.7947 | -1.1755 | -9.7328 | 7.3817 | 0.1816 | 0.1036 | 0.0245 | 0.0245 |
| Univariate ARIMA Extrapolation Forecast Performance | |||||||||
| time | % S.E. | PE | MAPE | sMAPE | Sq.E | MSE | RMSE | ScaledE | MASE |
| 201 | -10.01 | 0.8528 | 0.8528 | 1.4868 | 6.3409 | 0 | 0 | -0.8084 | 0.8084 |
| 202 | -4.48 | 1.2701 | 1.0614 | 2.4834 | 21.0764 | 13.7086 | 3.7025 | 1.4738 | 1.1411 |
| 203 | -11.3058 | 1.1185 | 1.0805 | 2.5016 | 13.3228 | 13.58 | 3.6851 | 1.1718 | 1.1513 |
| 204 | 4.9073 | 0.8056 | 1.0118 | 2.2134 | 13.643 | 13.5958 | 3.6872 | 1.1858 | 1.1599 |
| 205 | 4.1071 | 0.7371 | 0.9568 | 2.0042 | 8.8821 | 12.653 | 3.5571 | 0.9568 | 1.1193 |
| 206 | 2.5877 | 8.9543 | 2.2897 | 2.0994 | 3.6073 | 11.1454 | 3.3385 | -0.6097 | 1.0344 |
| 207 | -4.8377 | -7.901 | 3.0913 | 2.0275 | 0.6418 | 9.6449 | 3.1056 | 0.2572 | 0.9233 |
| 208 | -8.9064 | 0.9264 | 2.8207 | 1.9898 | 38.0808 | 13.1994 | 3.6331 | -1.9811 | 1.0556 |
| 209 | -10.071 | 1.1577 | 2.6359 | 2.0741 | 10.1241 | 12.8577 | 3.5858 | 1.0215 | 1.0518 |
| 210 | -8.2448 | 1.0991 | 2.4823 | 2.1107 | 34.5112 | 15.023 | 3.876 | 1.8859 | 1.1352 |
| 211 | -74.4648 | 1.0135 | 2.3487 | 2.1056 | 19.2759 | 15.4096 | 3.9255 | 1.4095 | 1.1601 |
| 212 | -3.7141 | 1.4206 | 2.2714 | 2.3388 | 15.7624 | 15.439 | 3.9293 | 1.2746 | 1.1697 |