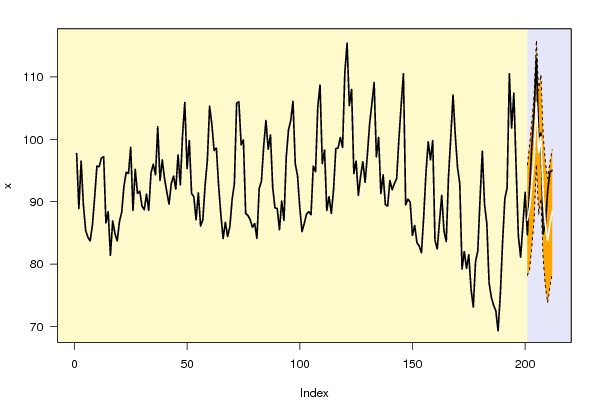
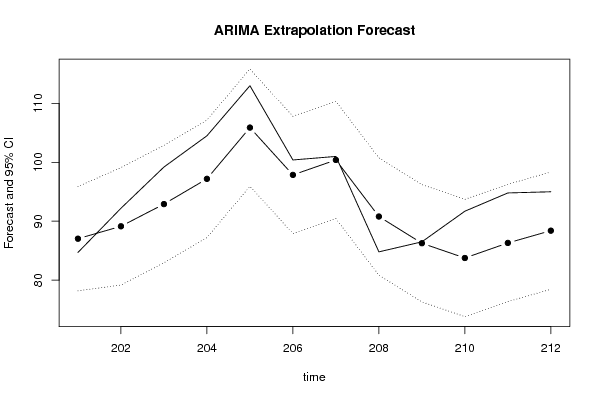
| Univariate ARIMA Extrapolation Forecast | ||||||||
| time | Y[t] | F[t] | 95% LB | 95% UB | p-value (H0: Y[t] = F[t]) | P(F[t]>Y[t-1]) | P(F[t]>Y[t-s]) | P(F[t]>Y[200]) |
| 188 | 69.3 | - | - | - | - | - | - | - |
| 189 | 75.2 | - | - | - | - | - | - | - |
| 190 | 83.5 | - | - | - | - | - | - | - |
| 191 | 90.5 | - | - | - | - | - | - | - |
| 192 | 92.2 | - | - | - | - | - | - | - |
| 193 | 110.5 | - | - | - | - | - | - | - |
| 194 | 101.8 | - | - | - | - | - | - | - |
| 195 | 107.4 | - | - | - | - | - | - | - |
| 196 | 95.5 | - | - | - | - | - | - | - |
| 197 | 84.5 | - | - | - | - | - | - | - |
| 198 | 81.1 | - | - | - | - | - | - | - |
| 199 | 86.2 | - | - | - | - | - | - | - |
| 200 | 91.5 | - | - | - | - | - | - | - |
| 201 | 84.7 | 87.0336 | 78.1868 | 95.8804 | 0.3026 | 0.1612 | 0.9956 | 0.1612 |
| 202 | 92.2 | 89.1392 | 79.1684 | 99.11 | 0.2737 | 0.8086 | 0.8662 | 0.3213 |
| 203 | 99.2 | 92.9098 | 82.939 | 102.8806 | 0.1081 | 0.5555 | 0.6821 | 0.6092 |
| 204 | 104.5 | 97.1934 | 87.2258 | 107.1609 | 0.0754 | 0.3466 | 0.8369 | 0.8685 |
| 205 | 113 | 105.8917 | 95.9361 | 115.8473 | 0.0808 | 0.608 | 0.1821 | 0.9977 |
| 206 | 100.4 | 97.8623 | 87.9067 | 107.8179 | 0.3087 | 0.0014 | 0.2191 | 0.8948 |
| 207 | 101 | 100.4008 | 90.4452 | 110.3564 | 0.453 | 0.5001 | 0.0841 | 0.9601 |
| 208 | 84.8 | 90.7992 | 80.8436 | 100.7548 | 0.1188 | 0.0223 | 0.1774 | 0.4451 |
| 209 | 86.5 | 86.2666 | 76.311 | 96.2222 | 0.4817 | 0.6136 | 0.636 | 0.1514 |
| 210 | 91.7 | 83.7587 | 73.8031 | 93.7144 | 0.059 | 0.2947 | 0.6997 | 0.0637 |
| 211 | 94.8 | 86.3147 | 76.3591 | 96.2703 | 0.0474 | 0.1445 | 0.509 | 0.1537 |
| 212 | 95 | 88.3977 | 78.4421 | 98.3533 | 0.0968 | 0.1038 | 0.2707 | 0.2707 |
| Univariate ARIMA Extrapolation Forecast Performance | |||||||||
| time | % S.E. | PE | MAPE | sMAPE | Sq.E | MSE | RMSE | ScaledE | MASE |
| 201 | 0.0519 | -0.0276 | 0.0276 | 0.0272 | 5.4458 | 0 | 0 | -0.3781 | 0.3781 |
| 202 | 0.0571 | 0.0332 | 0.0304 | 0.0305 | 9.3685 | 7.4071 | 2.7216 | 0.4959 | 0.437 |
| 203 | 0.0548 | 0.0634 | 0.0414 | 0.0421 | 39.5662 | 18.1268 | 4.2576 | 1.019 | 0.631 |
| 204 | 0.0523 | 0.0699 | 0.0485 | 0.0497 | 53.3869 | 26.9419 | 5.1906 | 1.1837 | 0.7692 |
| 205 | 0.048 | 0.0629 | 0.0514 | 0.0528 | 50.5279 | 31.6591 | 5.6266 | 1.1516 | 0.8456 |
| 206 | 0.0519 | 0.0253 | 0.047 | 0.0482 | 6.4397 | 27.4559 | 5.2398 | 0.4111 | 0.7732 |
| 207 | 0.0506 | 0.0059 | 0.0412 | 0.0422 | 0.359 | 23.5849 | 4.8564 | 0.0971 | 0.6766 |
| 208 | 0.0559 | -0.0707 | 0.0449 | 0.0455 | 35.9906 | 25.1356 | 5.0135 | -0.9719 | 0.7135 |
| 209 | 0.0589 | 0.0027 | 0.0402 | 0.0407 | 0.0545 | 22.3488 | 4.7275 | 0.0378 | 0.6385 |
| 210 | 0.0606 | 0.0866 | 0.0448 | 0.0457 | 63.0635 | 26.4203 | 5.1401 | 1.2865 | 0.7033 |
| 211 | 0.0588 | 0.0895 | 0.0489 | 0.0501 | 72.0002 | 30.5639 | 5.5285 | 1.3746 | 0.7643 |
| 212 | 0.0575 | 0.0695 | 0.0506 | 0.0519 | 43.5908 | 31.6495 | 5.6258 | 1.0696 | 0.7897 |