Free Statistics

of Irreproducible Research!

Author's title

Author*The author of this computation has been verified*
R Software Modulerwasp_autocorrelation.wasp
Title produced by software(Partial) Autocorrelation Function
Date of computationThu, 01 Feb 2018 09:28:28 +0100
Cite this page as followsStatistical Computations at FreeStatistics.org, Office for Research Development and Education, URL https://freestatistics.org/blog/index.php?v=date/2018/Feb/01/t1517473721gfs3doxynyu9phv.htm/, Retrieved Mon, 29 Apr 2024 01:49:53 +0000
Statistical Computations at FreeStatistics.org, Office for Research Development and Education, URL https://freestatistics.org/blog/index.php?pk=313578, Retrieved Mon, 29 Apr 2024 01:49:53 +0000
QR Codes:

Original text written by user:
IsPrivate?No (this computation is public)
User-defined keywords
Estimated Impact57
Family? (F = Feedback message, R = changed R code, M = changed R Module, P = changed Parameters, D = changed Data)
-       [(Partial) Autocorrelation Function] [] [2018-02-01 08:28:28] [5890cec7eb26e6825249cd142542fa6d] [Current]
Feedback Forum

Post a new message
Dataseries X:
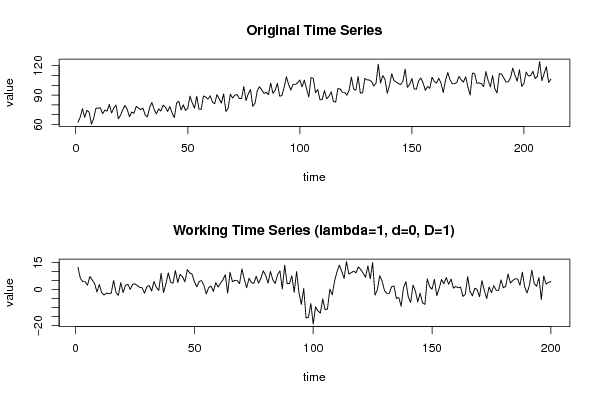
62.4
67.4
76.1
67.4
74.5
72.6
60.5
66.1
76.5
76.8
77
71
74.8
73.7
80.5
71.8
76.9
79.9
65.9
69.5
75.1
79.6
75.2
68
72.8
71.5
78.5
76.8
75.3
76.7
69.7
67.8
77.5
82.5
75.3
70.9
76
73.7
79.7
77.8
73.3
78.3
71.9
67
82
83.7
74.8
80
74.3
76.8
89
81.9
76.8
88.9
75.8
75.5
89.1
88
85.9
89.3
82.9
81.2
90.5
86.4
81.8
91.3
73.4
76.6
91
87
89.7
90.7
86.5
86.6
98.8
84.4
91.4
95.7
78.5
81.7
94.3
98.5
95.4
91.7
92.8
90.5
102.2
91.8
95
102
88.9
89.6
97.9
108.6
100.8
95.1
101
100.9
102.5
105.4
98.4
105.3
96.5
88.1
107.9
107
92.5
95.7
85.2
85.5
94.7
86.2
88.8
93.4
83.4
82.9
96.7
96.2
92.8
92.8
90
95.4
108.3
96.3
95
109
92
92.3
107
105.5
105.4
103.9
99.2
102.2
121.5
102.3
110
105.9
91.9
100
111.7
104.9
103.3
101.8
100.8
104.2
116.5
97.9
100.7
107
96.3
96
104.5
107.4
102.4
94.9
98.8
96.8
108.2
103.8
102.3
107.2
102
92.6
105.2
113
105.6
101.6
101.7
102.7
109
105.5
103.3
108.6
98.2
90
112.4
111.9
102.1
102.4
101.7
98.7
114
105.1
98.3
110
96.5
92.2
112
111.4
107.5
103.4
103.5
107.4
117.6
110.2
104.3
115.9
98.9
101.9
113.5
109.5
110
114.2
106.9
109.2
124.2
104.7
111.9
119
102.9
106.3


Summary of computational transaction
Raw Input view raw input (R code)
Raw Outputview raw output of R engine
Computing time2 seconds
R ServerBig Analytics Cloud Computing Center

\begin{tabular}{lllllllll}
\hline
Summary of computational transaction \tabularnewline
Raw Input view raw input (R code)  \tabularnewline
Raw Outputview raw output of R engine  \tabularnewline
Computing time2 seconds \tabularnewline
R ServerBig Analytics Cloud Computing Center \tabularnewline
\hline
\end{tabular}
%Source: https://freestatistics.org/blog/index.php?pk=313578&T=0

[TABLE]
[ROW]
Summary of computational transaction[/C][/ROW] [ROW]Raw Input[/C] view raw input (R code) [/C][/ROW] [ROW]Raw Output[/C]view raw output of R engine [/C][/ROW] [ROW]Computing time[/C]2 seconds[/C][/ROW] [ROW]R Server[/C]Big Analytics Cloud Computing Center[/C][/ROW] [/TABLE] Source: https://freestatistics.org/blog/index.php?pk=313578&T=0

Globally Unique Identifier (entire table): ba.freestatistics.org/blog/index.php?pk=313578&T=0

As an alternative you can also use a QR Code:  

The GUIDs for individual cells are displayed in the table below:

Summary of computational transaction
Raw Input view raw input (R code)
Raw Outputview raw output of R engine
Computing time2 seconds
R ServerBig Analytics Cloud Computing Center


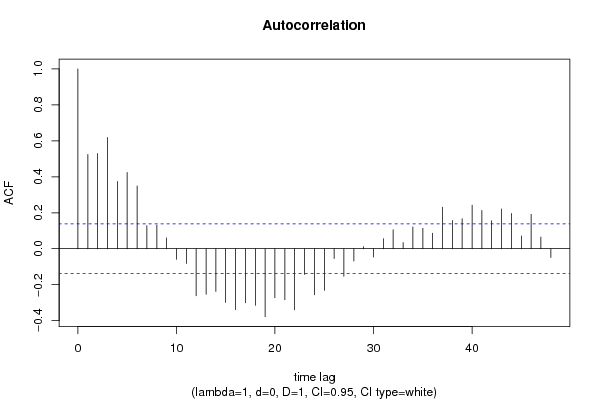
Autocorrelation Function
Time lag kACF(k)T-STATP-value
10.5244377.41670
20.5300317.49580
30.6191058.75550
40.3743175.29360
50.4236645.99150
60.3492234.93881e-06
70.1282941.81440.035561
80.1312381.8560.032463
90.0598180.8460.199296
10-0.059098-0.83580.202139
11-0.081615-1.15420.124895
12-0.261471-3.69780.00014
13-0.252927-3.57690.000218
14-0.23726-3.35540.000474
15-0.298356-4.21941.9e-05
16-0.339111-4.79582e-06
17-0.300921-4.25571.6e-05
18-0.314691-4.45047e-06
19-0.377929-5.34470
20-0.272098-3.84818e-05
21-0.283815-4.01374.2e-05
22-0.339184-4.79682e-06
23-0.142645-2.01730.0225
24-0.255809-3.61770.000188
25-0.231196-3.26960.000634
26-0.054957-0.77720.218975
27-0.152802-2.16090.015944
28-0.068199-0.96450.167985
290.011580.16380.43504
30-0.045951-0.64980.25827
310.0550830.7790.218453
320.1055721.4930.068504
330.0338830.47920.316167
340.1209041.70980.044424
350.1133621.60320.055236
360.0864831.22310.111373
370.2308823.26520.000644
380.1572272.22350.01365
390.1663052.35190.009825
400.241583.41650.000384
410.212863.01030.001473
420.1559192.2050.014296
430.2209913.12530.00102
440.1958782.77010.003066
450.0709361.00320.15849
460.1910662.70210.003741
470.0644060.91080.181737
48-0.048163-0.68110.248287

\begin{tabular}{lllllllll}
\hline
Autocorrelation Function \tabularnewline
Time lag k & ACF(k) & T-STAT & P-value \tabularnewline
1 & 0.524437 & 7.4167 & 0 \tabularnewline
2 & 0.530031 & 7.4958 & 0 \tabularnewline
3 & 0.619105 & 8.7555 & 0 \tabularnewline
4 & 0.374317 & 5.2936 & 0 \tabularnewline
5 & 0.423664 & 5.9915 & 0 \tabularnewline
6 & 0.349223 & 4.9388 & 1e-06 \tabularnewline
7 & 0.128294 & 1.8144 & 0.035561 \tabularnewline
8 & 0.131238 & 1.856 & 0.032463 \tabularnewline
9 & 0.059818 & 0.846 & 0.199296 \tabularnewline
10 & -0.059098 & -0.8358 & 0.202139 \tabularnewline
11 & -0.081615 & -1.1542 & 0.124895 \tabularnewline
12 & -0.261471 & -3.6978 & 0.00014 \tabularnewline
13 & -0.252927 & -3.5769 & 0.000218 \tabularnewline
14 & -0.23726 & -3.3554 & 0.000474 \tabularnewline
15 & -0.298356 & -4.2194 & 1.9e-05 \tabularnewline
16 & -0.339111 & -4.7958 & 2e-06 \tabularnewline
17 & -0.300921 & -4.2557 & 1.6e-05 \tabularnewline
18 & -0.314691 & -4.4504 & 7e-06 \tabularnewline
19 & -0.377929 & -5.3447 & 0 \tabularnewline
20 & -0.272098 & -3.8481 & 8e-05 \tabularnewline
21 & -0.283815 & -4.0137 & 4.2e-05 \tabularnewline
22 & -0.339184 & -4.7968 & 2e-06 \tabularnewline
23 & -0.142645 & -2.0173 & 0.0225 \tabularnewline
24 & -0.255809 & -3.6177 & 0.000188 \tabularnewline
25 & -0.231196 & -3.2696 & 0.000634 \tabularnewline
26 & -0.054957 & -0.7772 & 0.218975 \tabularnewline
27 & -0.152802 & -2.1609 & 0.015944 \tabularnewline
28 & -0.068199 & -0.9645 & 0.167985 \tabularnewline
29 & 0.01158 & 0.1638 & 0.43504 \tabularnewline
30 & -0.045951 & -0.6498 & 0.25827 \tabularnewline
31 & 0.055083 & 0.779 & 0.218453 \tabularnewline
32 & 0.105572 & 1.493 & 0.068504 \tabularnewline
33 & 0.033883 & 0.4792 & 0.316167 \tabularnewline
34 & 0.120904 & 1.7098 & 0.044424 \tabularnewline
35 & 0.113362 & 1.6032 & 0.055236 \tabularnewline
36 & 0.086483 & 1.2231 & 0.111373 \tabularnewline
37 & 0.230882 & 3.2652 & 0.000644 \tabularnewline
38 & 0.157227 & 2.2235 & 0.01365 \tabularnewline
39 & 0.166305 & 2.3519 & 0.009825 \tabularnewline
40 & 0.24158 & 3.4165 & 0.000384 \tabularnewline
41 & 0.21286 & 3.0103 & 0.001473 \tabularnewline
42 & 0.155919 & 2.205 & 0.014296 \tabularnewline
43 & 0.220991 & 3.1253 & 0.00102 \tabularnewline
44 & 0.195878 & 2.7701 & 0.003066 \tabularnewline
45 & 0.070936 & 1.0032 & 0.15849 \tabularnewline
46 & 0.191066 & 2.7021 & 0.003741 \tabularnewline
47 & 0.064406 & 0.9108 & 0.181737 \tabularnewline
48 & -0.048163 & -0.6811 & 0.248287 \tabularnewline
\hline
\end{tabular}
%Source: https://freestatistics.org/blog/index.php?pk=313578&T=1

[TABLE]
[ROW][C]Autocorrelation Function[/C][/ROW]
[ROW][C]Time lag k[/C][C]ACF(k)[/C][C]T-STAT[/C][C]P-value[/C][/ROW]
[ROW][C]1[/C][C]0.524437[/C][C]7.4167[/C][C]0[/C][/ROW]
[ROW][C]2[/C][C]0.530031[/C][C]7.4958[/C][C]0[/C][/ROW]
[ROW][C]3[/C][C]0.619105[/C][C]8.7555[/C][C]0[/C][/ROW]
[ROW][C]4[/C][C]0.374317[/C][C]5.2936[/C][C]0[/C][/ROW]
[ROW][C]5[/C][C]0.423664[/C][C]5.9915[/C][C]0[/C][/ROW]
[ROW][C]6[/C][C]0.349223[/C][C]4.9388[/C][C]1e-06[/C][/ROW]
[ROW][C]7[/C][C]0.128294[/C][C]1.8144[/C][C]0.035561[/C][/ROW]
[ROW][C]8[/C][C]0.131238[/C][C]1.856[/C][C]0.032463[/C][/ROW]
[ROW][C]9[/C][C]0.059818[/C][C]0.846[/C][C]0.199296[/C][/ROW]
[ROW][C]10[/C][C]-0.059098[/C][C]-0.8358[/C][C]0.202139[/C][/ROW]
[ROW][C]11[/C][C]-0.081615[/C][C]-1.1542[/C][C]0.124895[/C][/ROW]
[ROW][C]12[/C][C]-0.261471[/C][C]-3.6978[/C][C]0.00014[/C][/ROW]
[ROW][C]13[/C][C]-0.252927[/C][C]-3.5769[/C][C]0.000218[/C][/ROW]
[ROW][C]14[/C][C]-0.23726[/C][C]-3.3554[/C][C]0.000474[/C][/ROW]
[ROW][C]15[/C][C]-0.298356[/C][C]-4.2194[/C][C]1.9e-05[/C][/ROW]
[ROW][C]16[/C][C]-0.339111[/C][C]-4.7958[/C][C]2e-06[/C][/ROW]
[ROW][C]17[/C][C]-0.300921[/C][C]-4.2557[/C][C]1.6e-05[/C][/ROW]
[ROW][C]18[/C][C]-0.314691[/C][C]-4.4504[/C][C]7e-06[/C][/ROW]
[ROW][C]19[/C][C]-0.377929[/C][C]-5.3447[/C][C]0[/C][/ROW]
[ROW][C]20[/C][C]-0.272098[/C][C]-3.8481[/C][C]8e-05[/C][/ROW]
[ROW][C]21[/C][C]-0.283815[/C][C]-4.0137[/C][C]4.2e-05[/C][/ROW]
[ROW][C]22[/C][C]-0.339184[/C][C]-4.7968[/C][C]2e-06[/C][/ROW]
[ROW][C]23[/C][C]-0.142645[/C][C]-2.0173[/C][C]0.0225[/C][/ROW]
[ROW][C]24[/C][C]-0.255809[/C][C]-3.6177[/C][C]0.000188[/C][/ROW]
[ROW][C]25[/C][C]-0.231196[/C][C]-3.2696[/C][C]0.000634[/C][/ROW]
[ROW][C]26[/C][C]-0.054957[/C][C]-0.7772[/C][C]0.218975[/C][/ROW]
[ROW][C]27[/C][C]-0.152802[/C][C]-2.1609[/C][C]0.015944[/C][/ROW]
[ROW][C]28[/C][C]-0.068199[/C][C]-0.9645[/C][C]0.167985[/C][/ROW]
[ROW][C]29[/C][C]0.01158[/C][C]0.1638[/C][C]0.43504[/C][/ROW]
[ROW][C]30[/C][C]-0.045951[/C][C]-0.6498[/C][C]0.25827[/C][/ROW]
[ROW][C]31[/C][C]0.055083[/C][C]0.779[/C][C]0.218453[/C][/ROW]
[ROW][C]32[/C][C]0.105572[/C][C]1.493[/C][C]0.068504[/C][/ROW]
[ROW][C]33[/C][C]0.033883[/C][C]0.4792[/C][C]0.316167[/C][/ROW]
[ROW][C]34[/C][C]0.120904[/C][C]1.7098[/C][C]0.044424[/C][/ROW]
[ROW][C]35[/C][C]0.113362[/C][C]1.6032[/C][C]0.055236[/C][/ROW]
[ROW][C]36[/C][C]0.086483[/C][C]1.2231[/C][C]0.111373[/C][/ROW]
[ROW][C]37[/C][C]0.230882[/C][C]3.2652[/C][C]0.000644[/C][/ROW]
[ROW][C]38[/C][C]0.157227[/C][C]2.2235[/C][C]0.01365[/C][/ROW]
[ROW][C]39[/C][C]0.166305[/C][C]2.3519[/C][C]0.009825[/C][/ROW]
[ROW][C]40[/C][C]0.24158[/C][C]3.4165[/C][C]0.000384[/C][/ROW]
[ROW][C]41[/C][C]0.21286[/C][C]3.0103[/C][C]0.001473[/C][/ROW]
[ROW][C]42[/C][C]0.155919[/C][C]2.205[/C][C]0.014296[/C][/ROW]
[ROW][C]43[/C][C]0.220991[/C][C]3.1253[/C][C]0.00102[/C][/ROW]
[ROW][C]44[/C][C]0.195878[/C][C]2.7701[/C][C]0.003066[/C][/ROW]
[ROW][C]45[/C][C]0.070936[/C][C]1.0032[/C][C]0.15849[/C][/ROW]
[ROW][C]46[/C][C]0.191066[/C][C]2.7021[/C][C]0.003741[/C][/ROW]
[ROW][C]47[/C][C]0.064406[/C][C]0.9108[/C][C]0.181737[/C][/ROW]
[ROW][C]48[/C][C]-0.048163[/C][C]-0.6811[/C][C]0.248287[/C][/ROW]
[/TABLE]
Source: https://freestatistics.org/blog/index.php?pk=313578&T=1

Globally Unique Identifier (entire table): ba.freestatistics.org/blog/index.php?pk=313578&T=1

As an alternative you can also use a QR Code:  

The GUIDs for individual cells are displayed in the table below:

Autocorrelation Function
Time lag kACF(k)T-STATP-value
10.5244377.41670
20.5300317.49580
30.6191058.75550
40.3743175.29360
50.4236645.99150
60.3492234.93881e-06
70.1282941.81440.035561
80.1312381.8560.032463
90.0598180.8460.199296
10-0.059098-0.83580.202139
11-0.081615-1.15420.124895
12-0.261471-3.69780.00014
13-0.252927-3.57690.000218
14-0.23726-3.35540.000474
15-0.298356-4.21941.9e-05
16-0.339111-4.79582e-06
17-0.300921-4.25571.6e-05
18-0.314691-4.45047e-06
19-0.377929-5.34470
20-0.272098-3.84818e-05
21-0.283815-4.01374.2e-05
22-0.339184-4.79682e-06
23-0.142645-2.01730.0225
24-0.255809-3.61770.000188
25-0.231196-3.26960.000634
26-0.054957-0.77720.218975
27-0.152802-2.16090.015944
28-0.068199-0.96450.167985
290.011580.16380.43504
30-0.045951-0.64980.25827
310.0550830.7790.218453
320.1055721.4930.068504
330.0338830.47920.316167
340.1209041.70980.044424
350.1133621.60320.055236
360.0864831.22310.111373
370.2308823.26520.000644
380.1572272.22350.01365
390.1663052.35190.009825
400.241583.41650.000384
410.212863.01030.001473
420.1559192.2050.014296
430.2209913.12530.00102
440.1958782.77010.003066
450.0709361.00320.15849
460.1910662.70210.003741
470.0644060.91080.181737
48-0.048163-0.68110.248287


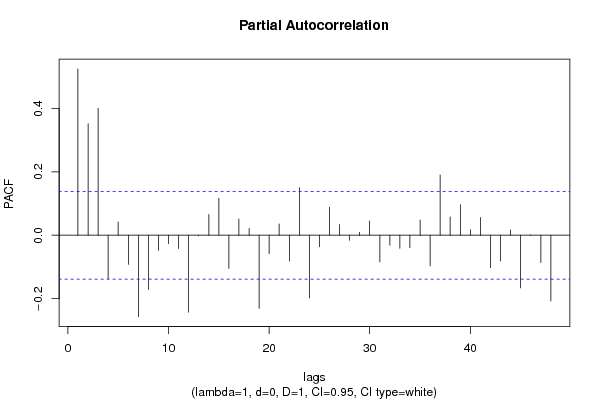
Partial Autocorrelation Function
Time lag kPACF(k)T-STATP-value
10.5244377.41670
20.3517364.97431e-06
30.4005295.66430
4-0.137339-1.94230.026754
50.0420460.59460.276386
6-0.091936-1.30020.097519
7-0.256753-3.6310.000179
8-0.171392-2.42380.008123
9-0.048329-0.68350.247551
10-0.026522-0.37510.354
11-0.041831-0.59160.277401
12-0.24247-3.4290.000368
13-0.001826-0.02580.489713
140.0652740.92310.178529
150.1167841.65160.050095
16-0.105061-1.48580.069455
170.0513150.72570.234435
180.021510.30420.380646
19-0.230556-3.26060.000654
20-0.058079-0.82140.206208
210.0355410.50260.307891
22-0.081042-1.14610.12656
230.1496312.11610.017786
24-0.197565-2.7940.002856
25-0.036107-0.51060.305085
260.0883031.24880.106599
270.0339260.47980.315953
28-0.016042-0.22690.410381
290.0096590.13660.44574
300.0449280.63540.262956
31-0.084067-1.18890.117946
32-0.031829-0.45010.326554
33-0.040927-0.57880.281687
34-0.039504-0.55870.288504
350.0480180.67910.248938
36-0.096552-1.36540.086823
370.189952.68630.003916
380.0576980.8160.207743
390.0959331.35670.088203
400.0171060.24190.404546
410.055830.78960.215362
42-0.102188-1.44520.07499
43-0.081377-1.15080.125586
440.0164380.23250.408204
45-0.165948-2.34690.009955
460.0010440.01480.494116
47-0.08593-1.21520.112856
48-0.207551-2.93520.001862

\begin{tabular}{lllllllll}
\hline
Partial Autocorrelation Function \tabularnewline
Time lag k & PACF(k) & T-STAT & P-value \tabularnewline
1 & 0.524437 & 7.4167 & 0 \tabularnewline
2 & 0.351736 & 4.9743 & 1e-06 \tabularnewline
3 & 0.400529 & 5.6643 & 0 \tabularnewline
4 & -0.137339 & -1.9423 & 0.026754 \tabularnewline
5 & 0.042046 & 0.5946 & 0.276386 \tabularnewline
6 & -0.091936 & -1.3002 & 0.097519 \tabularnewline
7 & -0.256753 & -3.631 & 0.000179 \tabularnewline
8 & -0.171392 & -2.4238 & 0.008123 \tabularnewline
9 & -0.048329 & -0.6835 & 0.247551 \tabularnewline
10 & -0.026522 & -0.3751 & 0.354 \tabularnewline
11 & -0.041831 & -0.5916 & 0.277401 \tabularnewline
12 & -0.24247 & -3.429 & 0.000368 \tabularnewline
13 & -0.001826 & -0.0258 & 0.489713 \tabularnewline
14 & 0.065274 & 0.9231 & 0.178529 \tabularnewline
15 & 0.116784 & 1.6516 & 0.050095 \tabularnewline
16 & -0.105061 & -1.4858 & 0.069455 \tabularnewline
17 & 0.051315 & 0.7257 & 0.234435 \tabularnewline
18 & 0.02151 & 0.3042 & 0.380646 \tabularnewline
19 & -0.230556 & -3.2606 & 0.000654 \tabularnewline
20 & -0.058079 & -0.8214 & 0.206208 \tabularnewline
21 & 0.035541 & 0.5026 & 0.307891 \tabularnewline
22 & -0.081042 & -1.1461 & 0.12656 \tabularnewline
23 & 0.149631 & 2.1161 & 0.017786 \tabularnewline
24 & -0.197565 & -2.794 & 0.002856 \tabularnewline
25 & -0.036107 & -0.5106 & 0.305085 \tabularnewline
26 & 0.088303 & 1.2488 & 0.106599 \tabularnewline
27 & 0.033926 & 0.4798 & 0.315953 \tabularnewline
28 & -0.016042 & -0.2269 & 0.410381 \tabularnewline
29 & 0.009659 & 0.1366 & 0.44574 \tabularnewline
30 & 0.044928 & 0.6354 & 0.262956 \tabularnewline
31 & -0.084067 & -1.1889 & 0.117946 \tabularnewline
32 & -0.031829 & -0.4501 & 0.326554 \tabularnewline
33 & -0.040927 & -0.5788 & 0.281687 \tabularnewline
34 & -0.039504 & -0.5587 & 0.288504 \tabularnewline
35 & 0.048018 & 0.6791 & 0.248938 \tabularnewline
36 & -0.096552 & -1.3654 & 0.086823 \tabularnewline
37 & 0.18995 & 2.6863 & 0.003916 \tabularnewline
38 & 0.057698 & 0.816 & 0.207743 \tabularnewline
39 & 0.095933 & 1.3567 & 0.088203 \tabularnewline
40 & 0.017106 & 0.2419 & 0.404546 \tabularnewline
41 & 0.05583 & 0.7896 & 0.215362 \tabularnewline
42 & -0.102188 & -1.4452 & 0.07499 \tabularnewline
43 & -0.081377 & -1.1508 & 0.125586 \tabularnewline
44 & 0.016438 & 0.2325 & 0.408204 \tabularnewline
45 & -0.165948 & -2.3469 & 0.009955 \tabularnewline
46 & 0.001044 & 0.0148 & 0.494116 \tabularnewline
47 & -0.08593 & -1.2152 & 0.112856 \tabularnewline
48 & -0.207551 & -2.9352 & 0.001862 \tabularnewline
\hline
\end{tabular}
%Source: https://freestatistics.org/blog/index.php?pk=313578&T=2

[TABLE]
[ROW][C]Partial Autocorrelation Function[/C][/ROW]
[ROW][C]Time lag k[/C][C]PACF(k)[/C][C]T-STAT[/C][C]P-value[/C][/ROW]
[ROW][C]1[/C][C]0.524437[/C][C]7.4167[/C][C]0[/C][/ROW]
[ROW][C]2[/C][C]0.351736[/C][C]4.9743[/C][C]1e-06[/C][/ROW]
[ROW][C]3[/C][C]0.400529[/C][C]5.6643[/C][C]0[/C][/ROW]
[ROW][C]4[/C][C]-0.137339[/C][C]-1.9423[/C][C]0.026754[/C][/ROW]
[ROW][C]5[/C][C]0.042046[/C][C]0.5946[/C][C]0.276386[/C][/ROW]
[ROW][C]6[/C][C]-0.091936[/C][C]-1.3002[/C][C]0.097519[/C][/ROW]
[ROW][C]7[/C][C]-0.256753[/C][C]-3.631[/C][C]0.000179[/C][/ROW]
[ROW][C]8[/C][C]-0.171392[/C][C]-2.4238[/C][C]0.008123[/C][/ROW]
[ROW][C]9[/C][C]-0.048329[/C][C]-0.6835[/C][C]0.247551[/C][/ROW]
[ROW][C]10[/C][C]-0.026522[/C][C]-0.3751[/C][C]0.354[/C][/ROW]
[ROW][C]11[/C][C]-0.041831[/C][C]-0.5916[/C][C]0.277401[/C][/ROW]
[ROW][C]12[/C][C]-0.24247[/C][C]-3.429[/C][C]0.000368[/C][/ROW]
[ROW][C]13[/C][C]-0.001826[/C][C]-0.0258[/C][C]0.489713[/C][/ROW]
[ROW][C]14[/C][C]0.065274[/C][C]0.9231[/C][C]0.178529[/C][/ROW]
[ROW][C]15[/C][C]0.116784[/C][C]1.6516[/C][C]0.050095[/C][/ROW]
[ROW][C]16[/C][C]-0.105061[/C][C]-1.4858[/C][C]0.069455[/C][/ROW]
[ROW][C]17[/C][C]0.051315[/C][C]0.7257[/C][C]0.234435[/C][/ROW]
[ROW][C]18[/C][C]0.02151[/C][C]0.3042[/C][C]0.380646[/C][/ROW]
[ROW][C]19[/C][C]-0.230556[/C][C]-3.2606[/C][C]0.000654[/C][/ROW]
[ROW][C]20[/C][C]-0.058079[/C][C]-0.8214[/C][C]0.206208[/C][/ROW]
[ROW][C]21[/C][C]0.035541[/C][C]0.5026[/C][C]0.307891[/C][/ROW]
[ROW][C]22[/C][C]-0.081042[/C][C]-1.1461[/C][C]0.12656[/C][/ROW]
[ROW][C]23[/C][C]0.149631[/C][C]2.1161[/C][C]0.017786[/C][/ROW]
[ROW][C]24[/C][C]-0.197565[/C][C]-2.794[/C][C]0.002856[/C][/ROW]
[ROW][C]25[/C][C]-0.036107[/C][C]-0.5106[/C][C]0.305085[/C][/ROW]
[ROW][C]26[/C][C]0.088303[/C][C]1.2488[/C][C]0.106599[/C][/ROW]
[ROW][C]27[/C][C]0.033926[/C][C]0.4798[/C][C]0.315953[/C][/ROW]
[ROW][C]28[/C][C]-0.016042[/C][C]-0.2269[/C][C]0.410381[/C][/ROW]
[ROW][C]29[/C][C]0.009659[/C][C]0.1366[/C][C]0.44574[/C][/ROW]
[ROW][C]30[/C][C]0.044928[/C][C]0.6354[/C][C]0.262956[/C][/ROW]
[ROW][C]31[/C][C]-0.084067[/C][C]-1.1889[/C][C]0.117946[/C][/ROW]
[ROW][C]32[/C][C]-0.031829[/C][C]-0.4501[/C][C]0.326554[/C][/ROW]
[ROW][C]33[/C][C]-0.040927[/C][C]-0.5788[/C][C]0.281687[/C][/ROW]
[ROW][C]34[/C][C]-0.039504[/C][C]-0.5587[/C][C]0.288504[/C][/ROW]
[ROW][C]35[/C][C]0.048018[/C][C]0.6791[/C][C]0.248938[/C][/ROW]
[ROW][C]36[/C][C]-0.096552[/C][C]-1.3654[/C][C]0.086823[/C][/ROW]
[ROW][C]37[/C][C]0.18995[/C][C]2.6863[/C][C]0.003916[/C][/ROW]
[ROW][C]38[/C][C]0.057698[/C][C]0.816[/C][C]0.207743[/C][/ROW]
[ROW][C]39[/C][C]0.095933[/C][C]1.3567[/C][C]0.088203[/C][/ROW]
[ROW][C]40[/C][C]0.017106[/C][C]0.2419[/C][C]0.404546[/C][/ROW]
[ROW][C]41[/C][C]0.05583[/C][C]0.7896[/C][C]0.215362[/C][/ROW]
[ROW][C]42[/C][C]-0.102188[/C][C]-1.4452[/C][C]0.07499[/C][/ROW]
[ROW][C]43[/C][C]-0.081377[/C][C]-1.1508[/C][C]0.125586[/C][/ROW]
[ROW][C]44[/C][C]0.016438[/C][C]0.2325[/C][C]0.408204[/C][/ROW]
[ROW][C]45[/C][C]-0.165948[/C][C]-2.3469[/C][C]0.009955[/C][/ROW]
[ROW][C]46[/C][C]0.001044[/C][C]0.0148[/C][C]0.494116[/C][/ROW]
[ROW][C]47[/C][C]-0.08593[/C][C]-1.2152[/C][C]0.112856[/C][/ROW]
[ROW][C]48[/C][C]-0.207551[/C][C]-2.9352[/C][C]0.001862[/C][/ROW]
[/TABLE]
Source: https://freestatistics.org/blog/index.php?pk=313578&T=2

Globally Unique Identifier (entire table): ba.freestatistics.org/blog/index.php?pk=313578&T=2

As an alternative you can also use a QR Code:  

The GUIDs for individual cells are displayed in the table below:

Partial Autocorrelation Function
Time lag kPACF(k)T-STATP-value
10.5244377.41670
20.3517364.97431e-06
30.4005295.66430
4-0.137339-1.94230.026754
50.0420460.59460.276386
6-0.091936-1.30020.097519
7-0.256753-3.6310.000179
8-0.171392-2.42380.008123
9-0.048329-0.68350.247551
10-0.026522-0.37510.354
11-0.041831-0.59160.277401
12-0.24247-3.4290.000368
13-0.001826-0.02580.489713
140.0652740.92310.178529
150.1167841.65160.050095
16-0.105061-1.48580.069455
170.0513150.72570.234435
180.021510.30420.380646
19-0.230556-3.26060.000654
20-0.058079-0.82140.206208
210.0355410.50260.307891
22-0.081042-1.14610.12656
230.1496312.11610.017786
24-0.197565-2.7940.002856
25-0.036107-0.51060.305085
260.0883031.24880.106599
270.0339260.47980.315953
28-0.016042-0.22690.410381
290.0096590.13660.44574
300.0449280.63540.262956
31-0.084067-1.18890.117946
32-0.031829-0.45010.326554
33-0.040927-0.57880.281687
34-0.039504-0.55870.288504
350.0480180.67910.248938
36-0.096552-1.36540.086823
370.189952.68630.003916
380.0576980.8160.207743
390.0959331.35670.088203
400.0171060.24190.404546
410.055830.78960.215362
42-0.102188-1.44520.07499
43-0.081377-1.15080.125586
440.0164380.23250.408204
45-0.165948-2.34690.009955
460.0010440.01480.494116
47-0.08593-1.21520.112856
48-0.207551-2.93520.001862


Parameters (Session):
par1 = 1 ; par2 = Do not include Seasonal Dummies ; par3 = No Linear Trend ; par6 = 12 ;
Parameters (R input):
par1 = 48 ; par2 = 1 ; par3 = 0 ; par4 = 1 ; par5 = 12 ; par6 = White Noise ; par7 = 0.95 ; par8 = ;
R code (references can be found in the software module):
par8 <- ''
par7 <- '0.95'
par6 <- 'White Noise'
par5 <- '12'
par4 <- '1'
par3 <- '1'
par2 <- '1'
par1 <- '48'
if (par1 == 'Default') {
par1 = 10*log10(length(x))
} else {
par1 <- as.numeric(par1)
}
par2 <- as.numeric(par2)
par3 <- as.numeric(par3)
par4 <- as.numeric(par4)
par5 <- as.numeric(par5)
if (par6 == 'White Noise') par6 <- 'white' else par6 <- 'ma'
par7 <- as.numeric(par7)
if (par8 != '') par8 <- as.numeric(par8)
x <- na.omit(x)
ox <- x
if (par8 == '') {
if (par2 == 0) {
x <- log(x)
} else {
x <- (x ^ par2 - 1) / par2
}
} else {
x <- log(x,base=par8)
}
if (par3 > 0) x <- diff(x,lag=1,difference=par3)
if (par4 > 0) x <- diff(x,lag=par5,difference=par4)
bitmap(file='picts.png')
op <- par(mfrow=c(2,1))
plot(ox,type='l',main='Original Time Series',xlab='time',ylab='value')
if (par8=='') {
mytitle <- paste('Working Time Series (lambda=',par2,', d=',par3,', D=',par4,')',sep='')
mysub <- paste('(lambda=',par2,', d=',par3,', D=',par4,', CI=', par7, ', CI type=',par6,')',sep='')
} else {
mytitle <- paste('Working Time Series (base=',par8,', d=',par3,', D=',par4,')',sep='')
mysub <- paste('(base=',par8,', d=',par3,', D=',par4,', CI=', par7, ', CI type=',par6,')',sep='')
}
plot(x,type='l', main=mytitle,xlab='time',ylab='value')
par(op)
dev.off()
bitmap(file='pic1.png')
racf <- acf(x, par1, main='Autocorrelation', xlab='time lag', ylab='ACF', ci.type=par6, ci=par7, sub=mysub)
dev.off()
bitmap(file='pic2.png')
rpacf <- pacf(x,par1,main='Partial Autocorrelation',xlab='lags',ylab='PACF',sub=mysub)
dev.off()
(myacf <- c(racf$acf))
(mypacf <- c(rpacf$acf))
lengthx <- length(x)
sqrtn <- sqrt(lengthx)
load(file='createtable')
a<-table.start()
a<-table.row.start(a)
a<-table.element(a,'Autocorrelation Function',4,TRUE)
a<-table.row.end(a)
a<-table.row.start(a)
a<-table.element(a,'Time lag k',header=TRUE)
a<-table.element(a,'ACF(k)',header=TRUE)
a<-table.element(a,'T-STAT',header=TRUE)
a<-table.element(a,'P-value',header=TRUE)
a<-table.row.end(a)
for (i in 2:(par1+1)) {
a<-table.row.start(a)
a<-table.element(a,i-1,header=TRUE)
a<-table.element(a,round(myacf[i],6))
mytstat <- myacf[i]*sqrtn
a<-table.element(a,round(mytstat,4))
a<-table.element(a,round(1-pt(abs(mytstat),lengthx),6))
a<-table.row.end(a)
}
a<-table.end(a)
table.save(a,file='mytable.tab')
a<-table.start()
a<-table.row.start(a)
a<-table.element(a,'Partial Autocorrelation Function',4,TRUE)
a<-table.row.end(a)
a<-table.row.start(a)
a<-table.element(a,'Time lag k',header=TRUE)
a<-table.element(a,'PACF(k)',header=TRUE)
a<-table.element(a,'T-STAT',header=TRUE)
a<-table.element(a,'P-value',header=TRUE)
a<-table.row.end(a)
for (i in 1:par1) {
a<-table.row.start(a)
a<-table.element(a,i,header=TRUE)
a<-table.element(a,round(mypacf[i],6))
mytstat <- mypacf[i]*sqrtn
a<-table.element(a,round(mytstat,4))
a<-table.element(a,round(1-pt(abs(mytstat),lengthx),6))
a<-table.row.end(a)
}
a<-table.end(a)
table.save(a,file='mytable1.tab')