| Tabulation of Results | ||
| Intention_to_Use x groupC | ||
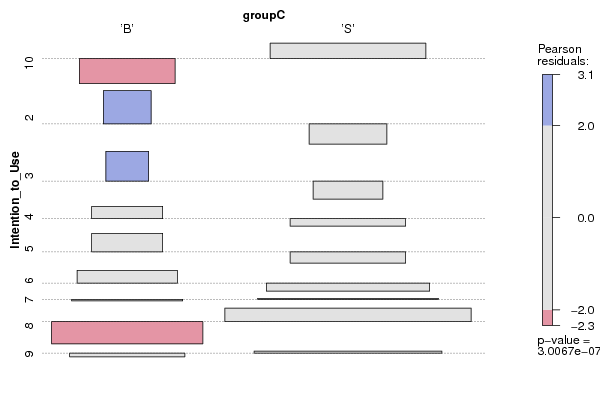
| 'B' | 'S' | 10 | 0 | 20 | 2 | 5 | 0 | 3 | 4 | 0 | 4 | 5 | 6 | 5 | 6 | 5 | 6 | 9 | 13 | 7 | 7 | 20 | 8 | 6 | 44 | 9 | 7 | 22 |
| Tabulation of Expected Results | ||
| Intention_to_Use x groupC | ||
| 'B' | 'S' | 10 | 5.47 | 14.53 | 2 | 1.37 | 3.63 | 3 | 1.09 | 2.91 | 4 | 3.01 | 7.99 | 5 | 3.01 | 7.99 | 6 | 6.02 | 15.98 | 7 | 7.39 | 19.61 | 8 | 13.69 | 36.31 | 9 | 7.94 | 21.06 |
| Statistical Results | |
| Pearson's Chi-squared test with simulated p-value (based on 2000 replicates) | |
| Exact Pearson Chi Square Statistic | 45.46 |
| P value | 0 |