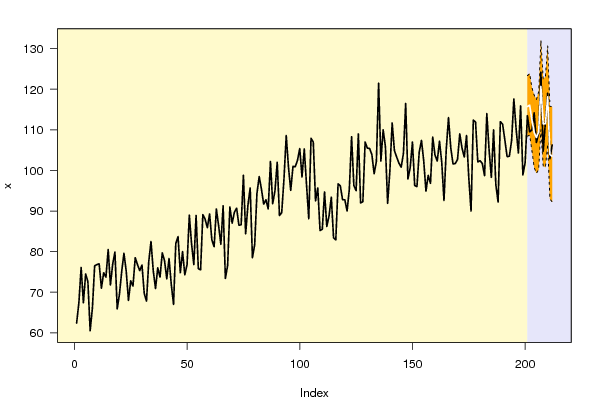
| Univariate ARIMA Extrapolation Forecast | ||||||||
| time | Y[t] | F[t] | 95% LB | 95% UB | p-value (H0: Y[t] = F[t]) | P(F[t]>Y[t-1]) | P(F[t]>Y[t-s]) | P(F[t]>Y[200]) |
| 188 | 92.2 | - | - | - | - | - | - | - |
| 189 | 112 | - | - | - | - | - | - | - |
| 190 | 111.4 | - | - | - | - | - | - | - |
| 191 | 107.5 | - | - | - | - | - | - | - |
| 192 | 103.4 | - | - | - | - | - | - | - |
| 193 | 103.5 | - | - | - | - | - | - | - |
| 194 | 107.4 | - | - | - | - | - | - | - |
| 195 | 117.6 | - | - | - | - | - | - | - |
| 196 | 110.2 | - | - | - | - | - | - | - |
| 197 | 104.3 | - | - | - | - | - | - | - |
| 198 | 115.9 | - | - | - | - | - | - | - |
| 199 | 98.9 | - | - | - | - | - | - | - |
| 200 | 101.9 | - | - | - | - | - | - | - |
| 201 | 113.5 | 115.7154 | 108.4277 | 123.3394 | 0.2845 | 0.9998 | 0.8303 | 0.9998 |
| 202 | 109.5 | 116.097 | 108.6897 | 123.8506 | 0.0477 | 0.7442 | 0.8825 | 0.9998 |
| 203 | 110 | 112.4997 | 104.9385 | 120.4341 | 0.2685 | 0.7706 | 0.8916 | 0.9956 |
| 204 | 114.2 | 109.4021 | 100.7389 | 118.5738 | 0.1526 | 0.4492 | 0.9002 | 0.9456 |
| 205 | 106.9 | 108.1133 | 99.3011 | 117.4587 | 0.3996 | 0.1009 | 0.8334 | 0.9037 |
| 206 | 109.2 | 109.4675 | 100.1658 | 119.3577 | 0.4789 | 0.6946 | 0.659 | 0.9332 |
| 207 | 124.2 | 120.6899 | 110.0517 | 132.0279 | 0.272 | 0.9765 | 0.7034 | 0.9994 |
| 208 | 104.7 | 111.4765 | 101.1226 | 122.5505 | 0.1152 | 0.0122 | 0.5894 | 0.955 |
| 209 | 111.9 | 111.5129 | 100.7553 | 123.0499 | 0.4738 | 0.8765 | 0.8898 | 0.9488 |
| 210 | 119 | 118.1402 | 106.4752 | 130.6716 | 0.4465 | 0.8355 | 0.637 | 0.9945 |
| 211 | 102.9 | 103.924 | 92.9728 | 115.7477 | 0.4326 | 0.0062 | 0.7975 | 0.6314 |
| 212 | 106.3 | 103.4939 | 92.2314 | 115.6856 | 0.326 | 0.538 | 0.6011 | 0.6011 |
| Univariate ARIMA Extrapolation Forecast Performance | |||||||||
| time | % S.E. | PE | MAPE | sMAPE | Sq.E | MSE | RMSE | ScaledE | MASE |
| 201 | 0.0336 | -0.0195 | 0.0195 | 0.0193 | 4.9081 | 0 | 0 | -0.2814 | 0.2814 |
| 202 | 0.0341 | -0.0602 | 0.0399 | 0.0389 | 43.5203 | 24.2142 | 4.9208 | -0.838 | 0.5597 |
| 203 | 0.036 | -0.0227 | 0.0342 | 0.0334 | 6.2483 | 18.2256 | 4.2691 | -0.3175 | 0.479 |
| 204 | 0.0428 | 0.042 | 0.0361 | 0.0358 | 23.0197 | 19.4241 | 4.4073 | 0.6094 | 0.5116 |
| 205 | 0.0441 | -0.0113 | 0.0312 | 0.0309 | 1.472 | 15.8337 | 3.9792 | -0.1541 | 0.4401 |
| 206 | 0.0461 | -0.0024 | 0.0264 | 0.0262 | 0.0716 | 13.2067 | 3.6341 | -0.034 | 0.3724 |
| 207 | 0.0479 | 0.0283 | 0.0267 | 0.0265 | 12.3207 | 13.0801 | 3.6166 | 0.4459 | 0.3829 |
| 208 | 0.0507 | -0.0647 | 0.0314 | 0.031 | 45.9205 | 17.1851 | 4.1455 | -0.8608 | 0.4426 |
| 209 | 0.0528 | 0.0035 | 0.0283 | 0.028 | 0.1498 | 15.2923 | 3.9105 | 0.0492 | 0.3989 |
| 210 | 0.0541 | 0.0072 | 0.0262 | 0.0259 | 0.7393 | 13.837 | 3.7198 | 0.1092 | 0.3699 |
| 211 | 0.058 | -0.01 | 0.0247 | 0.0244 | 1.0485 | 12.6744 | 3.5601 | -0.1301 | 0.3481 |
| 212 | 0.0601 | 0.0264 | 0.0249 | 0.0246 | 7.874 | 12.2744 | 3.5035 | 0.3564 | 0.3488 |