| ANOVA Model | |||||||||
| Intention_to_Use ~ Relative_Advantage | |||||||||
| means | 8.947 | -4.822 | -5.947 | -3.225 | -2.477 | -1.982 | -1.29 | -1.166 | -0.114 |
| ANOVA Statistics | |||||
| Df | Sum Sq | Mean Sq | F value | Pr(>F) | |
| Relative_Advantage | 8 | 301.545 | 37.693 | 16.666 | 0 |
| Residuals | 170 | 384.489 | 2.262 | ||
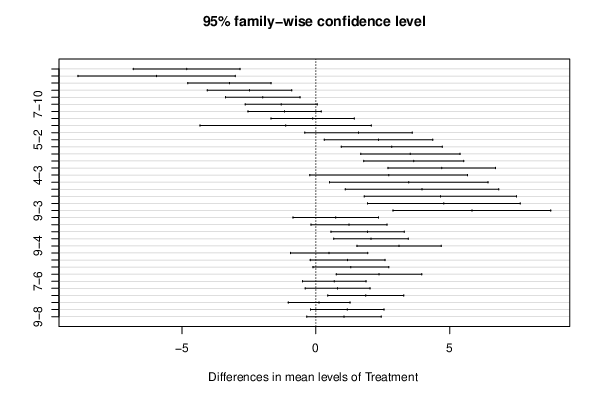
| Tukey Honest Significant Difference Comparisons | ||||
| diff | lwr | upr | p adj | |
| 2-10 | -4.822 | -6.814 | -2.831 | 0 |
| 3-10 | -5.947 | -8.883 | -3.012 | 0 |
| 4-10 | -3.225 | -4.779 | -1.671 | 0 |
| 5-10 | -2.477 | -4.054 | -0.899 | 0 |
| 6-10 | -1.982 | -3.377 | -0.587 | 0 |
| 7-10 | -1.29 | -2.637 | 0.056 | 0.072 |
| 8-10 | -1.166 | -2.535 | 0.203 | 0.164 |
| 9-10 | -0.114 | -1.668 | 1.44 | 1 |
| 3-2 | -1.125 | -4.324 | 2.074 | 0.973 |
| 4-2 | 1.597 | -0.411 | 3.605 | 0.24 |
| 5-2 | 2.346 | 0.32 | 4.372 | 0.011 |
| 6-2 | 2.841 | 0.953 | 4.728 | 0 |
| 7-2 | 3.532 | 1.68 | 5.384 | 0 |
| 8-2 | 3.656 | 1.788 | 5.524 | 0 |
| 9-2 | 4.708 | 2.7 | 6.716 | 0 |
| 4-3 | 2.722 | -0.225 | 5.669 | 0.095 |
| 5-3 | 3.471 | 0.511 | 6.43 | 0.009 |
| 6-3 | 3.966 | 1.1 | 6.831 | 0.001 |
| 7-3 | 4.657 | 1.814 | 7.5 | 0 |
| 8-3 | 4.781 | 1.928 | 7.635 | 0 |
| 9-3 | 5.833 | 2.886 | 8.78 | 0 |
| 5-4 | 0.748 | -0.85 | 2.347 | 0.867 |
| 6-4 | 1.243 | -0.175 | 2.661 | 0.137 |
| 7-4 | 1.935 | 0.564 | 3.306 | 0.001 |
| 8-4 | 2.059 | 0.667 | 3.451 | 0 |
| 9-4 | 3.111 | 1.536 | 4.686 | 0 |
| 6-5 | 0.495 | -0.949 | 1.938 | 0.977 |
| 7-5 | 1.187 | -0.21 | 2.584 | 0.167 |
| 8-5 | 1.311 | -0.108 | 2.729 | 0.095 |
| 9-5 | 2.363 | 0.765 | 3.961 | 0 |
| 7-6 | 0.692 | -0.495 | 1.878 | 0.661 |
| 8-6 | 0.816 | -0.396 | 2.027 | 0.466 |
| 9-6 | 1.868 | 0.45 | 3.286 | 0.002 |
| 8-7 | 0.124 | -1.032 | 1.28 | 1 |
| 9-7 | 1.176 | -0.194 | 2.547 | 0.157 |
| 9-8 | 1.052 | -0.34 | 2.444 | 0.305 |
| Levenes Test for Homogeneity of Variance | |||
| Df | F value | Pr(>F) | |
| Group | 8 | 2.127 | 0.036 |
| 170 | |||