| Multiple Linear Regression - Estimated Regression Equation |
| Winst[t] = -207273000 + 46988.6Volume[t] -21088500AverageVix[t] + 17934100HighVix[t] + e[t] |
| Multiple Linear Regression - Ordinary Least Squares | |||||
| Variable | Parameter | S.D. | T-STAT H0: parameter = 0 | 2-tail p-value | 1-tail p-value |
| (Intercept) | -2.073e+08 | 6.092e+07 | -3.4020e+00 | 0.01446 | 0.007229 |
| Volume | +4.699e+04 | 2.145e+04 | +2.1910e+00 | 0.07101 | 0.03551 |
| AverageVix | -2.109e+07 | 8.962e+06 | -2.3530e+00 | 0.05683 | 0.02841 |
| HighVix | +1.793e+07 | 6.066e+06 | +2.9570e+00 | 0.02539 | 0.0127 |
| Multiple Linear Regression - Regression Statistics | |
| Multiple R | 0.9525 |
| R-squared | 0.9073 |
| Adjusted R-squared | 0.8609 |
| F-TEST (value) | 19.57 |
| F-TEST (DF numerator) | 3 |
| F-TEST (DF denominator) | 6 |
| p-value | 0.001682 |
| Multiple Linear Regression - Residual Statistics | |
| Residual Standard Deviation | 1.976e+07 |
| Sum Squared Residuals | 2.342e+15 |
| Menu of Residual Diagnostics | |
| Description | Link |
| Histogram | Compute |
| Central Tendency | Compute |
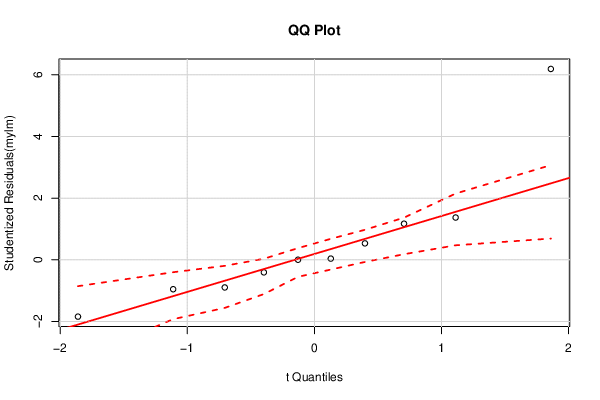
| QQ Plot | Compute |
| Kernel Density Plot | Compute |
| Skewness/Kurtosis Test | Compute |
| Skewness-Kurtosis Plot | Compute |
| Harrell-Davis Plot | Compute |
| Bootstrap Plot -- Central Tendency | Compute |
| Blocked Bootstrap Plot -- Central Tendency | Compute |
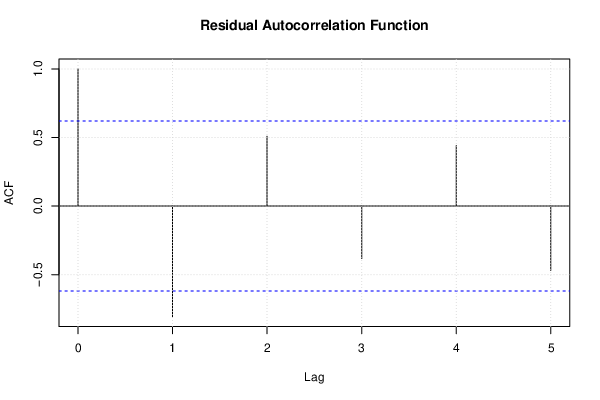
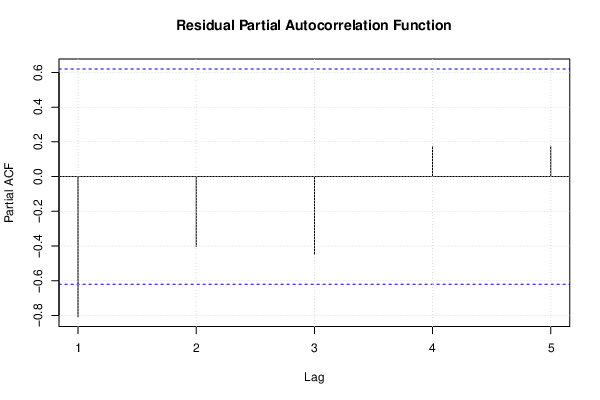
| (Partial) Autocorrelation Plot | Compute |
| Spectral Analysis | Compute |
| Tukey lambda PPCC Plot | Compute |
| Box-Cox Normality Plot | Compute |
| Summary Statistics | Compute |
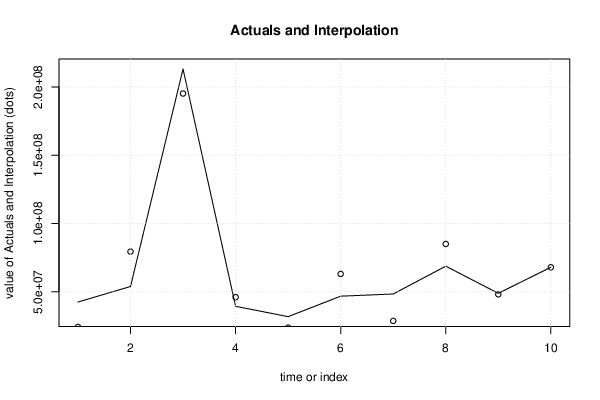
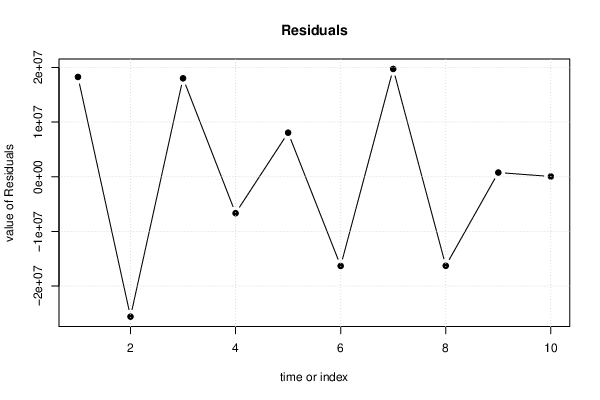
| Multiple Linear Regression - Actuals, Interpolation, and Residuals | |||
| Time or Index | Actuals | Interpolation Forecast | Residuals Prediction Error |
| 1 | 4.24e+07 | 2.415e+07 | 1.825e+07 |
| 2 | 5.38e+07 | 7.939e+07 | -2.559e+07 |
| 3 | 2.132e+08 | 1.952e+08 | 1.8e+07 |
| 4 | 3.93e+07 | 4.597e+07 | -6.666e+06 |
| 5 | 3.17e+07 | 2.364e+07 | 8.058e+06 |
| 6 | 4.67e+07 | 6.301e+07 | -1.631e+07 |
| 7 | 4.83e+07 | 2.858e+07 | 1.972e+07 |
| 8 | 6.87e+07 | 8.498e+07 | -1.628e+07 |
| 9 | 4.88e+07 | 4.803e+07 | 7.698e+05 |
| 10 | 6.79e+07 | 6.785e+07 | 4.704e+04 |
| Ramsey RESET F-Test for powers (2 and 3) of fitted values |
> reset_test_fitted RESET test data: mylm RESET = 15.827, df1 = 2, df2 = 4, p-value = 0.01259 |
| Ramsey RESET F-Test for powers (2 and 3) of regressors |
> reset_test_regressors RESET test data: mylm RESET = NaN, df1 = 6, df2 = 0, p-value = NA |
| Ramsey RESET F-Test for powers (2 and 3) of principal components |
> reset_test_principal_components RESET test data: mylm RESET = 12.668, df1 = 2, df2 = 4, p-value = 0.01859 |
| Variance Inflation Factors (Multicollinearity) |
> vif
    Volume AverageVix    HighVix
   4.51819   10.05039   11.53244
|