| Multiple Linear Regression - Estimated Regression Equation |
| Winst[t] = -239968000 + 76817.1Volume[t] -7763530AverageVix[t] + 1139550HighVix[t] + e[t] |
| Multiple Linear Regression - Ordinary Least Squares | |||||
| Variable | Parameter | S.D. | T-STAT H0: parameter = 0 | 2-tail p-value | 1-tail p-value |
| (Intercept) | -2.4e+08 | 7.657e+07 | -3.1340e+00 | 0.009512 | 0.004756 |
| Volume | +7.682e+04 | 2.251e+04 | +3.4130e+00 | 0.005796 | 0.002898 |
| AverageVix | -7.764e+06 | 6.69e+06 | -1.1600e+00 | 0.2704 | 0.1352 |
| HighVix | +1.14e+06 | 3.144e+06 | +3.6240e-01 | 0.7239 | 0.3619 |
| Multiple Linear Regression - Regression Statistics | |
| Multiple R | 0.8087 |
| R-squared | 0.654 |
| Adjusted R-squared | 0.5597 |
| F-TEST (value) | 6.931 |
| F-TEST (DF numerator) | 3 |
| F-TEST (DF denominator) | 11 |
| p-value | 0.006918 |
| Multiple Linear Regression - Residual Statistics | |
| Residual Standard Deviation | 2.86e+07 |
| Sum Squared Residuals | 8.999e+15 |
| Menu of Residual Diagnostics | |
| Description | Link |
| Histogram | Compute |
| Central Tendency | Compute |
| QQ Plot | Compute |
| Kernel Density Plot | Compute |
| Skewness/Kurtosis Test | Compute |
| Skewness-Kurtosis Plot | Compute |
| Harrell-Davis Plot | Compute |
| Bootstrap Plot -- Central Tendency | Compute |
| Blocked Bootstrap Plot -- Central Tendency | Compute |
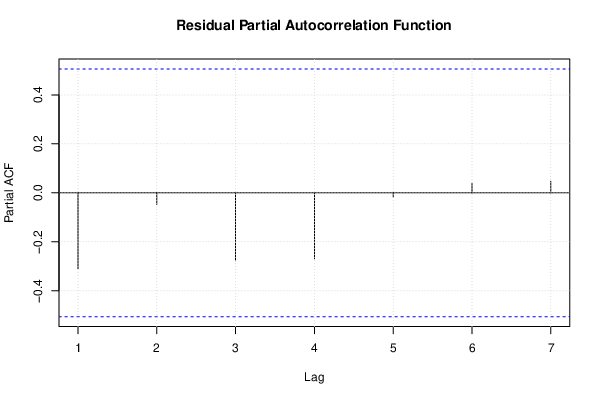
| (Partial) Autocorrelation Plot | Compute |
| Spectral Analysis | Compute |
| Tukey lambda PPCC Plot | Compute |
| Box-Cox Normality Plot | Compute |
| Summary Statistics | Compute |
| Multiple Linear Regression - Actuals, Interpolation, and Residuals | |||
| Time or Index | Actuals | Interpolation Forecast | Residuals Prediction Error |
| 1 | 4.24e+07 | 5.185e+07 | -9.446e+06 |
| 2 | 5.38e+07 | 8.89e+07 | -3.51e+07 |
| 3 | 2.132e+08 | 1.562e+08 | 5.701e+07 |
| 4 | 3.93e+07 | 5.157e+07 | -1.227e+07 |
| 5 | 3.17e+07 | 1.137e+07 | 2.033e+07 |
| 6 | 4.67e+07 | 6.075e+07 | -1.405e+07 |
| 7 | 4.83e+07 | 6.169e+07 | -1.339e+07 |
| 8 | 6.87e+07 | 9.144e+07 | -2.274e+07 |
| 9 | 4.88e+07 | 3.875e+07 | 1.005e+07 |
| 10 | 6.79e+07 | 5.019e+07 | 1.771e+07 |
| 11 | 6.46e+07 | 9.65e+07 | -3.19e+07 |
| 12 | 6.45e+07 | 6.403e+07 | 4.666e+05 |
| 13 | 9.28e+07 | 1.091e+08 | -1.631e+07 |
| 14 | 7.051e+07 | 5.006e+07 | 2.045e+07 |
| 15 | 7.691e+07 | 4.77e+07 | 2.921e+07 |
| Ramsey RESET F-Test for powers (2 and 3) of fitted values |
> reset_test_fitted RESET test data: mylm RESET = 38.786, df1 = 2, df2 = 9, p-value = 3.766e-05 |
| Ramsey RESET F-Test for powers (2 and 3) of regressors |
> reset_test_regressors RESET test data: mylm RESET = 9.9217, df1 = 6, df2 = 5, p-value = 0.01175 |
| Ramsey RESET F-Test for powers (2 and 3) of principal components |
> reset_test_principal_components RESET test data: mylm RESET = 10.103, df1 = 2, df2 = 9, p-value = 0.005006 |
| Variance Inflation Factors (Multicollinearity) |
> vif
    Volume AverageVix    HighVix
  3.376318   7.448475   6.174210
|