Free Statistics

of Irreproducible Research!

Author's title

Author*The author of this computation has been verified*
R Software Modulerwasp_autocorrelation.wasp
Title produced by software(Partial) Autocorrelation Function
Date of computationFri, 21 Dec 2018 19:25:21 +0100
Cite this page as followsStatistical Computations at FreeStatistics.org, Office for Research Development and Education, URL https://freestatistics.org/blog/index.php?v=date/2018/Dec/21/t1545417016rrexapa1xm8izjt.htm/, Retrieved Sat, 04 May 2024 16:07:07 +0000
Statistical Computations at FreeStatistics.org, Office for Research Development and Education, URL https://freestatistics.org/blog/index.php?pk=316202, Retrieved Sat, 04 May 2024 16:07:07 +0000
QR Codes:

Original text written by user:
IsPrivate?No (this computation is public)
User-defined keywords
Estimated Impact86
Family? (F = Feedback message, R = changed R code, M = changed R Module, P = changed Parameters, D = changed Data)
-       [(Partial) Autocorrelation Function] [Autocorrelatie bo...] [2018-12-21 18:25:21] [8607e318ea7bb53061252e65c5c0fa8a] [Current]
Feedback Forum

Post a new message
Dataseries X:
2570
2669
2450
2842
3440
2678
2981
2260
2844
2546
2456
2295
2379
2471
2057
2280
2351
2276
2548
2311
2201
2725
2408
2139
1898
2539
2070
2063
2565
2443
2196
2799
2076
2628
2292
2155
2476
2138
1854
2081
1795
1756
2237
1960
1829
2524
2077
2366
2185
2098
1836
1863
2044
2136
2931
3263
3328
3570
2313
1623
1316
1507
1419
1660
1790
1733
2086
1814
2241
1943
1773
2143
2087
1805
1913
2296
2500
2210
2526
2249
2024
2091
2045
1882
1831
1964
1763
1688
2149
1823
2094
2145
1791
1996
2097
1796
1963
2042
1746
2210
2968
3126
3708
3015
1569
1518
1393
1615
1777
1648
1463
1779


Summary of computational transaction
Raw Input view raw input (R code)
Raw Outputview raw output of R engine
Computing time3 seconds
R ServerBig Analytics Cloud Computing Center

\begin{tabular}{lllllllll}
\hline
Summary of computational transaction \tabularnewline
Raw Input view raw input (R code)  \tabularnewline
Raw Outputview raw output of R engine  \tabularnewline
Computing time3 seconds \tabularnewline
R ServerBig Analytics Cloud Computing Center \tabularnewline
\hline
\end{tabular}
%Source: https://freestatistics.org/blog/index.php?pk=316202&T=0

[TABLE]
[ROW]
Summary of computational transaction[/C][/ROW] [ROW]Raw Input[/C] view raw input (R code) [/C][/ROW] [ROW]Raw Output[/C]view raw output of R engine [/C][/ROW] [ROW]Computing time[/C]3 seconds[/C][/ROW] [ROW]R Server[/C]Big Analytics Cloud Computing Center[/C][/ROW] [/TABLE] Source: https://freestatistics.org/blog/index.php?pk=316202&T=0

Globally Unique Identifier (entire table): ba.freestatistics.org/blog/index.php?pk=316202&T=0

As an alternative you can also use a QR Code:  

The GUIDs for individual cells are displayed in the table below:

Summary of computational transaction
Raw Input view raw input (R code)
Raw Outputview raw output of R engine
Computing time3 seconds
R ServerBig Analytics Cloud Computing Center


Autocorrelation Function
Time lag kACF(k)T-STATP-value
1-0.172468-1.81710.035953
2-0.004948-0.05210.479259
30.0460920.48560.314103
4-0.289852-3.05380.001415
5-0.120202-1.26640.10401
60.0466850.49190.311895
7-0.098781-1.04070.150132
8-0.031543-0.33230.370135
90.1234681.30080.098008
10-0.012292-0.12950.448595
11-0.04475-0.47150.319114
120.214242.25720.012978
13-0.149474-1.57480.059073
140.0379920.40030.344864
150.0350380.36910.356361
16-0.173909-1.83220.034798
170.0192820.20310.419696
180.0037310.03930.484358
19-0.035042-0.36920.356344
20-0.033543-0.35340.362232
210.1600191.68590.047312
22-0.049682-0.52340.300859
23-0.018047-0.19010.424775
240.1377711.45150.07473

\begin{tabular}{lllllllll}
\hline
Autocorrelation Function \tabularnewline
Time lag k & ACF(k) & T-STAT & P-value \tabularnewline
1 & -0.172468 & -1.8171 & 0.035953 \tabularnewline
2 & -0.004948 & -0.0521 & 0.479259 \tabularnewline
3 & 0.046092 & 0.4856 & 0.314103 \tabularnewline
4 & -0.289852 & -3.0538 & 0.001415 \tabularnewline
5 & -0.120202 & -1.2664 & 0.10401 \tabularnewline
6 & 0.046685 & 0.4919 & 0.311895 \tabularnewline
7 & -0.098781 & -1.0407 & 0.150132 \tabularnewline
8 & -0.031543 & -0.3323 & 0.370135 \tabularnewline
9 & 0.123468 & 1.3008 & 0.098008 \tabularnewline
10 & -0.012292 & -0.1295 & 0.448595 \tabularnewline
11 & -0.04475 & -0.4715 & 0.319114 \tabularnewline
12 & 0.21424 & 2.2572 & 0.012978 \tabularnewline
13 & -0.149474 & -1.5748 & 0.059073 \tabularnewline
14 & 0.037992 & 0.4003 & 0.344864 \tabularnewline
15 & 0.035038 & 0.3691 & 0.356361 \tabularnewline
16 & -0.173909 & -1.8322 & 0.034798 \tabularnewline
17 & 0.019282 & 0.2031 & 0.419696 \tabularnewline
18 & 0.003731 & 0.0393 & 0.484358 \tabularnewline
19 & -0.035042 & -0.3692 & 0.356344 \tabularnewline
20 & -0.033543 & -0.3534 & 0.362232 \tabularnewline
21 & 0.160019 & 1.6859 & 0.047312 \tabularnewline
22 & -0.049682 & -0.5234 & 0.300859 \tabularnewline
23 & -0.018047 & -0.1901 & 0.424775 \tabularnewline
24 & 0.137771 & 1.4515 & 0.07473 \tabularnewline
\hline
\end{tabular}
%Source: https://freestatistics.org/blog/index.php?pk=316202&T=1

[TABLE]
[ROW][C]Autocorrelation Function[/C][/ROW]
[ROW][C]Time lag k[/C][C]ACF(k)[/C][C]T-STAT[/C][C]P-value[/C][/ROW]
[ROW][C]1[/C][C]-0.172468[/C][C]-1.8171[/C][C]0.035953[/C][/ROW]
[ROW][C]2[/C][C]-0.004948[/C][C]-0.0521[/C][C]0.479259[/C][/ROW]
[ROW][C]3[/C][C]0.046092[/C][C]0.4856[/C][C]0.314103[/C][/ROW]
[ROW][C]4[/C][C]-0.289852[/C][C]-3.0538[/C][C]0.001415[/C][/ROW]
[ROW][C]5[/C][C]-0.120202[/C][C]-1.2664[/C][C]0.10401[/C][/ROW]
[ROW][C]6[/C][C]0.046685[/C][C]0.4919[/C][C]0.311895[/C][/ROW]
[ROW][C]7[/C][C]-0.098781[/C][C]-1.0407[/C][C]0.150132[/C][/ROW]
[ROW][C]8[/C][C]-0.031543[/C][C]-0.3323[/C][C]0.370135[/C][/ROW]
[ROW][C]9[/C][C]0.123468[/C][C]1.3008[/C][C]0.098008[/C][/ROW]
[ROW][C]10[/C][C]-0.012292[/C][C]-0.1295[/C][C]0.448595[/C][/ROW]
[ROW][C]11[/C][C]-0.04475[/C][C]-0.4715[/C][C]0.319114[/C][/ROW]
[ROW][C]12[/C][C]0.21424[/C][C]2.2572[/C][C]0.012978[/C][/ROW]
[ROW][C]13[/C][C]-0.149474[/C][C]-1.5748[/C][C]0.059073[/C][/ROW]
[ROW][C]14[/C][C]0.037992[/C][C]0.4003[/C][C]0.344864[/C][/ROW]
[ROW][C]15[/C][C]0.035038[/C][C]0.3691[/C][C]0.356361[/C][/ROW]
[ROW][C]16[/C][C]-0.173909[/C][C]-1.8322[/C][C]0.034798[/C][/ROW]
[ROW][C]17[/C][C]0.019282[/C][C]0.2031[/C][C]0.419696[/C][/ROW]
[ROW][C]18[/C][C]0.003731[/C][C]0.0393[/C][C]0.484358[/C][/ROW]
[ROW][C]19[/C][C]-0.035042[/C][C]-0.3692[/C][C]0.356344[/C][/ROW]
[ROW][C]20[/C][C]-0.033543[/C][C]-0.3534[/C][C]0.362232[/C][/ROW]
[ROW][C]21[/C][C]0.160019[/C][C]1.6859[/C][C]0.047312[/C][/ROW]
[ROW][C]22[/C][C]-0.049682[/C][C]-0.5234[/C][C]0.300859[/C][/ROW]
[ROW][C]23[/C][C]-0.018047[/C][C]-0.1901[/C][C]0.424775[/C][/ROW]
[ROW][C]24[/C][C]0.137771[/C][C]1.4515[/C][C]0.07473[/C][/ROW]
[/TABLE]
Source: https://freestatistics.org/blog/index.php?pk=316202&T=1

Globally Unique Identifier (entire table): ba.freestatistics.org/blog/index.php?pk=316202&T=1

As an alternative you can also use a QR Code:  

The GUIDs for individual cells are displayed in the table below:

Autocorrelation Function
Time lag kACF(k)T-STATP-value
1-0.172468-1.81710.035953
2-0.004948-0.05210.479259
30.0460920.48560.314103
4-0.289852-3.05380.001415
5-0.120202-1.26640.10401
60.0466850.49190.311895
7-0.098781-1.04070.150132
8-0.031543-0.33230.370135
90.1234681.30080.098008
10-0.012292-0.12950.448595
11-0.04475-0.47150.319114
120.214242.25720.012978
13-0.149474-1.57480.059073
140.0379920.40030.344864
150.0350380.36910.356361
16-0.173909-1.83220.034798
170.0192820.20310.419696
180.0037310.03930.484358
19-0.035042-0.36920.356344
20-0.033543-0.35340.362232
210.1600191.68590.047312
22-0.049682-0.52340.300859
23-0.018047-0.19010.424775
240.1377711.45150.07473


Partial Autocorrelation Function
Time lag kPACF(k)T-STATP-value
1-0.172468-1.81710.035953
2-0.035757-0.37670.353549
30.0402890.42450.336022
4-0.284128-2.99350.0017
5-0.242434-2.55420.005999
6-0.042288-0.44550.328402
7-0.11123-1.17190.121877
8-0.196182-2.06690.020535
9-0.057168-0.60230.2741
10-0.04741-0.49950.30921
11-0.159473-1.68020.04787
120.0775540.81710.207817
13-0.115989-1.2220.112144
14-0.026122-0.27520.391833
15-0.041919-0.44160.329804
16-0.138208-1.45610.074092
17-0.083036-0.87480.191776
18-0.098384-1.03650.151102
19-0.076216-0.8030.21185
20-0.206804-2.17880.01573
21-0.018621-0.19620.422411
22-0.101474-1.06910.143673
23-0.169788-1.78880.038185
24-0.082009-0.8640.194722

\begin{tabular}{lllllllll}
\hline
Partial Autocorrelation Function \tabularnewline
Time lag k & PACF(k) & T-STAT & P-value \tabularnewline
1 & -0.172468 & -1.8171 & 0.035953 \tabularnewline
2 & -0.035757 & -0.3767 & 0.353549 \tabularnewline
3 & 0.040289 & 0.4245 & 0.336022 \tabularnewline
4 & -0.284128 & -2.9935 & 0.0017 \tabularnewline
5 & -0.242434 & -2.5542 & 0.005999 \tabularnewline
6 & -0.042288 & -0.4455 & 0.328402 \tabularnewline
7 & -0.11123 & -1.1719 & 0.121877 \tabularnewline
8 & -0.196182 & -2.0669 & 0.020535 \tabularnewline
9 & -0.057168 & -0.6023 & 0.2741 \tabularnewline
10 & -0.04741 & -0.4995 & 0.30921 \tabularnewline
11 & -0.159473 & -1.6802 & 0.04787 \tabularnewline
12 & 0.077554 & 0.8171 & 0.207817 \tabularnewline
13 & -0.115989 & -1.222 & 0.112144 \tabularnewline
14 & -0.026122 & -0.2752 & 0.391833 \tabularnewline
15 & -0.041919 & -0.4416 & 0.329804 \tabularnewline
16 & -0.138208 & -1.4561 & 0.074092 \tabularnewline
17 & -0.083036 & -0.8748 & 0.191776 \tabularnewline
18 & -0.098384 & -1.0365 & 0.151102 \tabularnewline
19 & -0.076216 & -0.803 & 0.21185 \tabularnewline
20 & -0.206804 & -2.1788 & 0.01573 \tabularnewline
21 & -0.018621 & -0.1962 & 0.422411 \tabularnewline
22 & -0.101474 & -1.0691 & 0.143673 \tabularnewline
23 & -0.169788 & -1.7888 & 0.038185 \tabularnewline
24 & -0.082009 & -0.864 & 0.194722 \tabularnewline
\hline
\end{tabular}
%Source: https://freestatistics.org/blog/index.php?pk=316202&T=2

[TABLE]
[ROW][C]Partial Autocorrelation Function[/C][/ROW]
[ROW][C]Time lag k[/C][C]PACF(k)[/C][C]T-STAT[/C][C]P-value[/C][/ROW]
[ROW][C]1[/C][C]-0.172468[/C][C]-1.8171[/C][C]0.035953[/C][/ROW]
[ROW][C]2[/C][C]-0.035757[/C][C]-0.3767[/C][C]0.353549[/C][/ROW]
[ROW][C]3[/C][C]0.040289[/C][C]0.4245[/C][C]0.336022[/C][/ROW]
[ROW][C]4[/C][C]-0.284128[/C][C]-2.9935[/C][C]0.0017[/C][/ROW]
[ROW][C]5[/C][C]-0.242434[/C][C]-2.5542[/C][C]0.005999[/C][/ROW]
[ROW][C]6[/C][C]-0.042288[/C][C]-0.4455[/C][C]0.328402[/C][/ROW]
[ROW][C]7[/C][C]-0.11123[/C][C]-1.1719[/C][C]0.121877[/C][/ROW]
[ROW][C]8[/C][C]-0.196182[/C][C]-2.0669[/C][C]0.020535[/C][/ROW]
[ROW][C]9[/C][C]-0.057168[/C][C]-0.6023[/C][C]0.2741[/C][/ROW]
[ROW][C]10[/C][C]-0.04741[/C][C]-0.4995[/C][C]0.30921[/C][/ROW]
[ROW][C]11[/C][C]-0.159473[/C][C]-1.6802[/C][C]0.04787[/C][/ROW]
[ROW][C]12[/C][C]0.077554[/C][C]0.8171[/C][C]0.207817[/C][/ROW]
[ROW][C]13[/C][C]-0.115989[/C][C]-1.222[/C][C]0.112144[/C][/ROW]
[ROW][C]14[/C][C]-0.026122[/C][C]-0.2752[/C][C]0.391833[/C][/ROW]
[ROW][C]15[/C][C]-0.041919[/C][C]-0.4416[/C][C]0.329804[/C][/ROW]
[ROW][C]16[/C][C]-0.138208[/C][C]-1.4561[/C][C]0.074092[/C][/ROW]
[ROW][C]17[/C][C]-0.083036[/C][C]-0.8748[/C][C]0.191776[/C][/ROW]
[ROW][C]18[/C][C]-0.098384[/C][C]-1.0365[/C][C]0.151102[/C][/ROW]
[ROW][C]19[/C][C]-0.076216[/C][C]-0.803[/C][C]0.21185[/C][/ROW]
[ROW][C]20[/C][C]-0.206804[/C][C]-2.1788[/C][C]0.01573[/C][/ROW]
[ROW][C]21[/C][C]-0.018621[/C][C]-0.1962[/C][C]0.422411[/C][/ROW]
[ROW][C]22[/C][C]-0.101474[/C][C]-1.0691[/C][C]0.143673[/C][/ROW]
[ROW][C]23[/C][C]-0.169788[/C][C]-1.7888[/C][C]0.038185[/C][/ROW]
[ROW][C]24[/C][C]-0.082009[/C][C]-0.864[/C][C]0.194722[/C][/ROW]
[/TABLE]
Source: https://freestatistics.org/blog/index.php?pk=316202&T=2

Globally Unique Identifier (entire table): ba.freestatistics.org/blog/index.php?pk=316202&T=2

As an alternative you can also use a QR Code:  

The GUIDs for individual cells are displayed in the table below:

Partial Autocorrelation Function
Time lag kPACF(k)T-STATP-value
1-0.172468-1.81710.035953
2-0.035757-0.37670.353549
30.0402890.42450.336022
4-0.284128-2.99350.0017
5-0.242434-2.55420.005999
6-0.042288-0.44550.328402
7-0.11123-1.17190.121877
8-0.196182-2.06690.020535
9-0.057168-0.60230.2741
10-0.04741-0.49950.30921
11-0.159473-1.68020.04787
120.0775540.81710.207817
13-0.115989-1.2220.112144
14-0.026122-0.27520.391833
15-0.041919-0.44160.329804
16-0.138208-1.45610.074092
17-0.083036-0.87480.191776
18-0.098384-1.03650.151102
19-0.076216-0.8030.21185
20-0.206804-2.17880.01573
21-0.018621-0.19620.422411
22-0.101474-1.06910.143673
23-0.169788-1.78880.038185
24-0.082009-0.8640.194722


Parameters (Session):
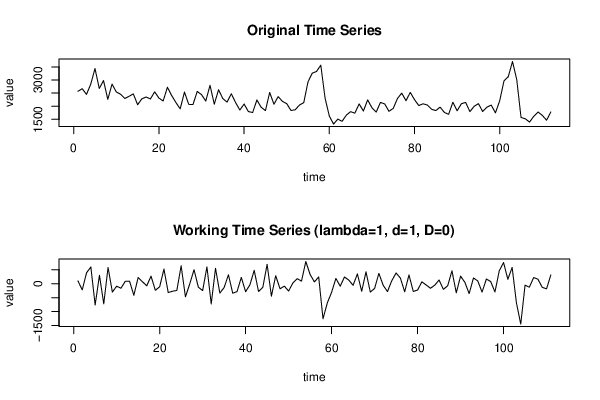
par1 = 24 ; par2 = 1 ; par3 = 1 ; par4 = 0 ; par5 = 12 ; par6 = White Noise ; par7 = 0.95 ;
Parameters (R input):
par1 = 24 ; par2 = 1 ; par3 = 1 ; par4 = 0 ; par5 = 12 ; par6 = White Noise ; par7 = 0.95 ; par8 = ;
R code (references can be found in the software module):
par8 <- ''
par7 <- '0.95'
par6 <- 'White Noise'
par5 <- '12'
par4 <- '0'
par3 <- '0'
par2 <- '1'
par1 <- '24'
if (par1 == 'Default') {
par1 = 10*log10(length(x))
} else {
par1 <- as.numeric(par1)
}
par2 <- as.numeric(par2)
par3 <- as.numeric(par3)
par4 <- as.numeric(par4)
par5 <- as.numeric(par5)
if (par6 == 'White Noise') par6 <- 'white' else par6 <- 'ma'
par7 <- as.numeric(par7)
if (par8 != '') par8 <- as.numeric(par8)
x <- na.omit(x)
ox <- x
if (par8 == '') {
if (par2 == 0) {
x <- log(x)
} else {
x <- (x ^ par2 - 1) / par2
}
} else {
x <- log(x,base=par8)
}
if (par3 > 0) x <- diff(x,lag=1,difference=par3)
if (par4 > 0) x <- diff(x,lag=par5,difference=par4)
bitmap(file='picts.png')
op <- par(mfrow=c(2,1))
plot(ox,type='l',main='Original Time Series',xlab='time',ylab='value')
if (par8=='') {
mytitle <- paste('Working Time Series (lambda=',par2,', d=',par3,', D=',par4,')',sep='')
mysub <- paste('(lambda=',par2,', d=',par3,', D=',par4,', CI=', par7, ', CI type=',par6,')',sep='')
} else {
mytitle <- paste('Working Time Series (base=',par8,', d=',par3,', D=',par4,')',sep='')
mysub <- paste('(base=',par8,', d=',par3,', D=',par4,', CI=', par7, ', CI type=',par6,')',sep='')
}
plot(x,type='l', main=mytitle,xlab='time',ylab='value')
par(op)
dev.off()
bitmap(file='pic1.png')
racf <- acf(x, par1, main='Autocorrelation', xlab='time lag', ylab='ACF', ci.type=par6, ci=par7, sub=mysub)
dev.off()
bitmap(file='pic2.png')
rpacf <- pacf(x,par1,main='Partial Autocorrelation',xlab='lags',ylab='PACF',sub=mysub)
dev.off()
(myacf <- c(racf$acf))
(mypacf <- c(rpacf$acf))
lengthx <- length(x)
sqrtn <- sqrt(lengthx)
load(file='createtable')
a<-table.start()
a<-table.row.start(a)
a<-table.element(a,'Autocorrelation Function',4,TRUE)
a<-table.row.end(a)
a<-table.row.start(a)
a<-table.element(a,'Time lag k',header=TRUE)
a<-table.element(a,'ACF(k)',header=TRUE)
a<-table.element(a,'T-STAT',header=TRUE)
a<-table.element(a,'P-value',header=TRUE)
a<-table.row.end(a)
for (i in 2:(par1+1)) {
a<-table.row.start(a)
a<-table.element(a,i-1,header=TRUE)
a<-table.element(a,round(myacf[i],6))
mytstat <- myacf[i]*sqrtn
a<-table.element(a,round(mytstat,4))
a<-table.element(a,round(1-pt(abs(mytstat),lengthx),6))
a<-table.row.end(a)
}
a<-table.end(a)
table.save(a,file='mytable.tab')
a<-table.start()
a<-table.row.start(a)
a<-table.element(a,'Partial Autocorrelation Function',4,TRUE)
a<-table.row.end(a)
a<-table.row.start(a)
a<-table.element(a,'Time lag k',header=TRUE)
a<-table.element(a,'PACF(k)',header=TRUE)
a<-table.element(a,'T-STAT',header=TRUE)
a<-table.element(a,'P-value',header=TRUE)
a<-table.row.end(a)
for (i in 1:par1) {
a<-table.row.start(a)
a<-table.element(a,i,header=TRUE)
a<-table.element(a,round(mypacf[i],6))
mytstat <- mypacf[i]*sqrtn
a<-table.element(a,round(mytstat,4))
a<-table.element(a,round(1-pt(abs(mytstat),lengthx),6))
a<-table.row.end(a)
}
a<-table.end(a)
table.save(a,file='mytable1.tab')