| Multiple Linear Regression - Estimated Regression Equation |
| (1-B)barrels_purchased[t] = + 845.337 + 65350.4`(1-B)defl_price1`[t] -66323.7`(1-B)defl_price2`[t] -244029`(1-B)defl_price3`[t] + 25199.6`(1-B)defl_price4`[t] + 409.57`(1-B)US_IND_PROD`[t] -0.553816`(1-B)barrels_purchased(t-1)`[t] -0.232488`(1-B)barrels_purchased(t-2)`[t] -0.0557447`(1-B)barrels_purchased(t-3)`[t] -0.159151`(1-B)barrels_purchased(t-4)`[t] -0.117906`(1-B)barrels_purchased(t-5)`[t] -0.125137`(1-B)barrels_purchased(t-6)`[t] + 0.302941`(1-B)barrels_purchased(t-1s)`[t] + e[t] |
| Warning: you did not specify the column number of the endogenous series! The first column was selected by default. |
| Multiple Linear Regression - Ordinary Least Squares | |||||
| Variable | Parameter | S.D. | T-STAT H0: parameter = 0 | 2-tail p-value | 1-tail p-value |
| (Intercept) | +845.3 | 967.7 | +8.7360e-01 | 0.3829 | 0.1915 |
| `(1-B)defl_price1` | +6.535e+04 | 9.472e+04 | +6.9000e-01 | 0.4906 | 0.2453 |
| `(1-B)defl_price2` | -6.632e+04 | 1.032e+05 | -6.4240e-01 | 0.521 | 0.2605 |
| `(1-B)defl_price3` | -2.44e+05 | 1.029e+05 | -2.3710e+00 | 0.01825 | 0.009123 |
| `(1-B)defl_price4` | +2.52e+04 | 9.626e+04 | +2.6180e-01 | 0.7936 | 0.3968 |
| `(1-B)US_IND_PROD` | +409.6 | 2114 | +1.9370e-01 | 0.8465 | 0.4233 |
| `(1-B)barrels_purchased(t-1)` | -0.5538 | 0.04753 | -1.1650e+01 | 4.526e-27 | 2.263e-27 |
| `(1-B)barrels_purchased(t-2)` | -0.2325 | 0.05427 | -4.2840e+00 | 2.32e-05 | 1.16e-05 |
| `(1-B)barrels_purchased(t-3)` | -0.05575 | 0.05464 | -1.0200e+00 | 0.3082 | 0.1541 |
| `(1-B)barrels_purchased(t-4)` | -0.1592 | 0.05485 | -2.9020e+00 | 0.003924 | 0.001962 |
| `(1-B)barrels_purchased(t-5)` | -0.1179 | 0.0545 | -2.1630e+00 | 0.03114 | 0.01557 |
| `(1-B)barrels_purchased(t-6)` | -0.1251 | 0.04732 | -2.6440e+00 | 0.008521 | 0.004261 |
| `(1-B)barrels_purchased(t-1s)` | +0.3029 | 0.04152 | +7.2950e+00 | 1.721e-12 | 8.606e-13 |
| Multiple Linear Regression - Regression Statistics | |
| Multiple R | 0.628 |
| R-squared | 0.3944 |
| Adjusted R-squared | 0.3755 |
| F-TEST (value) | 20.84 |
| F-TEST (DF numerator) | 12 |
| F-TEST (DF denominator) | 384 |
| p-value | 0 |
| Multiple Linear Regression - Residual Statistics | |
| Residual Standard Deviation | 1.812e+04 |
| Sum Squared Residuals | 1.261e+11 |
| Menu of Residual Diagnostics | |
| Description | Link |
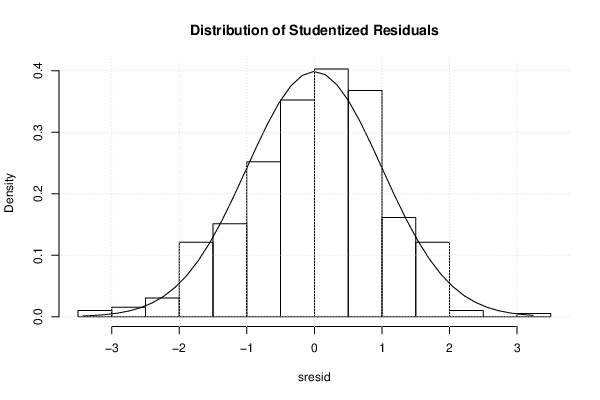
| Histogram | Compute |
| Central Tendency | Compute |
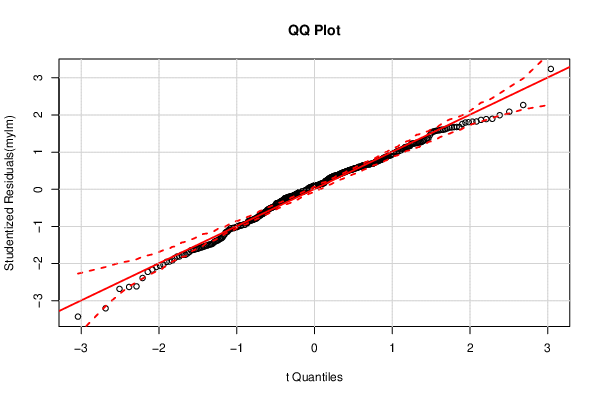
| QQ Plot | Compute |
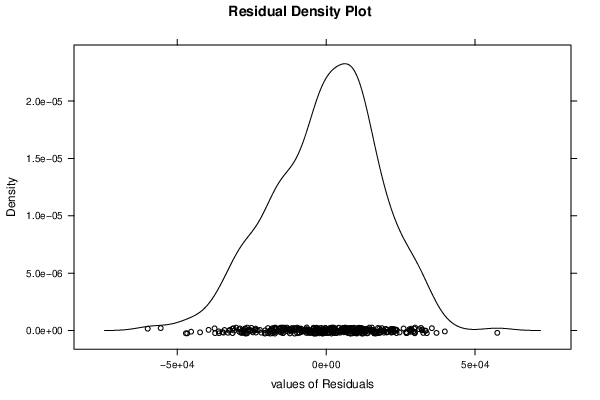
| Kernel Density Plot | Compute |
| Skewness/Kurtosis Test | Compute |
| Skewness-Kurtosis Plot | Compute |
| Harrell-Davis Plot | Compute |
| Bootstrap Plot -- Central Tendency | Compute |
| Blocked Bootstrap Plot -- Central Tendency | Compute |
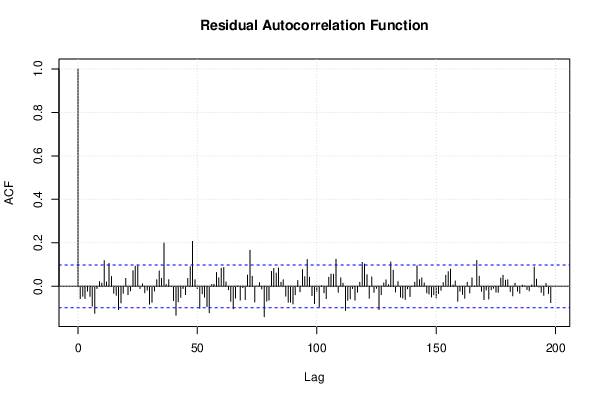
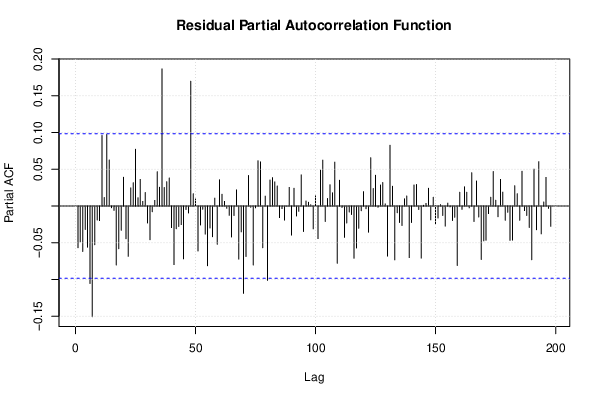
| (Partial) Autocorrelation Plot | Compute |
| Spectral Analysis | Compute |
| Tukey lambda PPCC Plot | Compute |
| Box-Cox Normality Plot | Compute |
| Summary Statistics | Compute |
| Ramsey RESET F-Test for powers (2 and 3) of fitted values |
> reset_test_fitted RESET test data: mylm RESET = 0.12431, df1 = 2, df2 = 382, p-value = 0.8831 |
| Ramsey RESET F-Test for powers (2 and 3) of regressors |
> reset_test_regressors RESET test data: mylm RESET = 1.1584, df1 = 24, df2 = 360, p-value = 0.2778 |
| Ramsey RESET F-Test for powers (2 and 3) of principal components |
> reset_test_principal_components RESET test data: mylm RESET = 6.2087, df1 = 2, df2 = 382, p-value = 0.002221 |
| Variance Inflation Factors (Multicollinearity) |
> vif
            `(1-B)defl_price1`             `(1-B)defl_price2`
                      1.242118                       1.444096
            `(1-B)defl_price3`             `(1-B)defl_price4`
                      1.427115                       1.248985
            `(1-B)US_IND_PROD`  `(1-B)barrels_purchased(t-1)`
                      1.020707                       1.433256
 `(1-B)barrels_purchased(t-2)`  `(1-B)barrels_purchased(t-3)`
                      1.867456                       1.895122
 `(1-B)barrels_purchased(t-4)`  `(1-B)barrels_purchased(t-5)`
                      1.905522                       1.886553
 `(1-B)barrels_purchased(t-6)` `(1-B)barrels_purchased(t-1s)`
                      1.421956                       1.048652
|