Free Statistics

of Irreproducible Research!

Author's title

Author*Unverified author*
R Software Modulerwasp_decompose.wasp
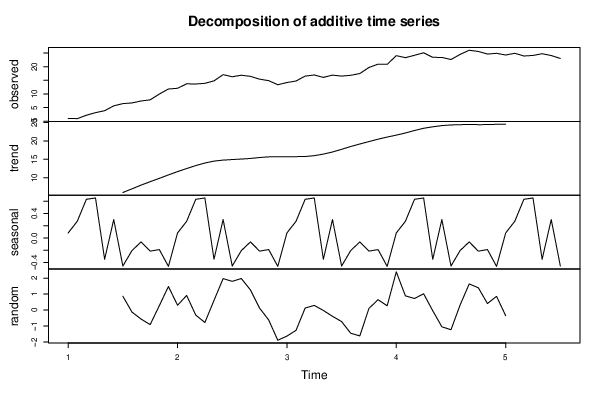
Title produced by softwareClassical Decomposition
Date of computationWed, 19 Dec 2018 22:18:50 +0100
Cite this page as followsStatistical Computations at FreeStatistics.org, Office for Research Development and Education, URL https://freestatistics.org/blog/index.php?v=date/2018/Dec/19/t1545254747m8jyyv58ja72fhq.htm/, Retrieved Mon, 29 Apr 2024 18:37:44 +0000
Statistical Computations at FreeStatistics.org, Office for Research Development and Education, URL https://freestatistics.org/blog/index.php?pk=316119, Retrieved Mon, 29 Apr 2024 18:37:44 +0000
QR Codes:

Original text written by user:
IsPrivate?No (this computation is public)
User-defined keywords
Estimated Impact26
Family? (F = Feedback message, R = changed R code, M = changed R Module, P = changed Parameters, D = changed Data)
-       [Classical Decomposition] [] [2018-12-19 21:18:50] [d41d8cd98f00b204e9800998ecf8427e] [Current]
Feedback Forum

Post a new message
Dataseries X:
1
0.91
2.17
3.112
3.823
5.608
6.428
6.679
7.393
7.821
9.939
11.8
12.06
13.7
13.63
13.88
14.78
17.07
16.29
16.85
16.44
15.4
14.86
13.36
14.17
14.73
16.53
16.94
16.05
16.9
16.53
16.82
17.47
19.7
20.92
20.84
24.04
23.3
24.17
25.09
23.42
23.39
22.62
24.5
26.02
25.58
24.63
24.89
24.27
24.91
23.92
24.12
24.74
24.08
23.01


Summary of computational transaction
Raw Input view raw input (R code)
Raw Outputview raw output of R engine
Computing time2 seconds
R ServerBig Analytics Cloud Computing Center

\begin{tabular}{lllllllll}
\hline
Summary of computational transaction \tabularnewline
Raw Input view raw input (R code)  \tabularnewline
Raw Outputview raw output of R engine  \tabularnewline
Computing time2 seconds \tabularnewline
R ServerBig Analytics Cloud Computing Center \tabularnewline
\hline
\end{tabular}
%Source: https://freestatistics.org/blog/index.php?pk=316119&T=0

[TABLE]
[ROW]
Summary of computational transaction[/C][/ROW] [ROW]Raw Input[/C] view raw input (R code) [/C][/ROW] [ROW]Raw Output[/C]view raw output of R engine [/C][/ROW] [ROW]Computing time[/C]2 seconds[/C][/ROW] [ROW]R Server[/C]Big Analytics Cloud Computing Center[/C][/ROW] [/TABLE] Source: https://freestatistics.org/blog/index.php?pk=316119&T=0

Globally Unique Identifier (entire table): ba.freestatistics.org/blog/index.php?pk=316119&T=0

As an alternative you can also use a QR Code:  

The GUIDs for individual cells are displayed in the table below:

Summary of computational transaction
Raw Input view raw input (R code)
Raw Outputview raw output of R engine
Computing time2 seconds
R ServerBig Analytics Cloud Computing Center


Classical Decomposition by Moving Averages
tObservationsFitTrendSeasonalRandom
11NANA0.0825217NA
20.91NANA0.273584NA
32.17NANA0.634029NA
43.112NANA0.655334NA
53.823NANA-0.348694NA
65.608NANA0.302126NA
76.4285.558796.01775-0.4589570.869207
86.6796.80547.0115-0.206103-0.126397
97.3937.957758.02192-0.0641658-0.564751
107.8218.733028.94808-0.215062-0.912022
119.9399.663519.85329-0.189780.275489
1211.810.322610.7874-0.4648321.47742
1312.0611.758411.67590.08252170.301562
1413.712.784212.51060.2735840.915791
1513.6313.945413.31140.634029-0.315404
1613.8814.659514.00410.655334-0.779459
1714.7814.176314.525-0.3486940.603735
1817.0715.097114.7950.3021261.97287
1916.2914.48914.9479-0.4589571.80104
2016.8514.872615.0788-0.2061031.97735
2116.4415.178315.2425-0.06416581.26167
2215.415.275815.4908-0.2150620.124228
2314.8615.481515.6712-0.18978-0.62147
2413.3615.252315.7171-0.464832-1.89225
2514.1715.802515.720.0825217-1.63252
2614.7316.002315.72870.273584-1.27233
2716.5316.404415.77040.6340290.125555
2816.9416.647815.99250.6553340.292166
2916.0516.075516.4242-0.348694-0.0254731
3016.917.290516.98830.302126-0.390459
3116.5317.252317.7112-0.458957-0.722293
3216.8218.273518.4796-0.206103-1.45348
3317.4719.090819.155-0.0641658-1.62083
3419.719.597919.8129-0.2150620.102145
3520.9220.269820.4596-0.189780.650197
3620.8420.572321.0371-0.4648320.267749
3724.0421.643821.56120.08252172.39623
3823.322.408622.1350.2735840.891416
3924.1723.445322.81120.6340290.724721
4025.0924.067823.41250.6553341.02217
4123.4223.463423.8121-0.348694-0.0433898
4223.3924.437524.13540.302126-1.04754
4322.6223.854824.3138-0.458957-1.23479
4424.524.184324.3904-0.2061030.315687
4526.0224.382924.4471-0.06416581.63708
4625.5824.181224.3963-0.2150621.39881
4724.6324.221124.4108-0.189780.408947
4824.8924.029824.4946-0.4648320.860249
4924.2724.622124.53960.0825217-0.352105
5024.91NANA0.273584NA
5123.92NANA0.634029NA
5224.12NANA0.655334NA
5324.74NANA-0.348694NA
5424.08NANA0.302126NA
5523.01NANA-0.458957NA

\begin{tabular}{lllllllll}
\hline
Classical Decomposition by Moving Averages \tabularnewline
t & Observations & Fit & Trend & Seasonal & Random \tabularnewline
1 & 1 & NA & NA & 0.0825217 & NA \tabularnewline
2 & 0.91 & NA & NA & 0.273584 & NA \tabularnewline
3 & 2.17 & NA & NA & 0.634029 & NA \tabularnewline
4 & 3.112 & NA & NA & 0.655334 & NA \tabularnewline
5 & 3.823 & NA & NA & -0.348694 & NA \tabularnewline
6 & 5.608 & NA & NA & 0.302126 & NA \tabularnewline
7 & 6.428 & 5.55879 & 6.01775 & -0.458957 & 0.869207 \tabularnewline
8 & 6.679 & 6.8054 & 7.0115 & -0.206103 & -0.126397 \tabularnewline
9 & 7.393 & 7.95775 & 8.02192 & -0.0641658 & -0.564751 \tabularnewline
10 & 7.821 & 8.73302 & 8.94808 & -0.215062 & -0.912022 \tabularnewline
11 & 9.939 & 9.66351 & 9.85329 & -0.18978 & 0.275489 \tabularnewline
12 & 11.8 & 10.3226 & 10.7874 & -0.464832 & 1.47742 \tabularnewline
13 & 12.06 & 11.7584 & 11.6759 & 0.0825217 & 0.301562 \tabularnewline
14 & 13.7 & 12.7842 & 12.5106 & 0.273584 & 0.915791 \tabularnewline
15 & 13.63 & 13.9454 & 13.3114 & 0.634029 & -0.315404 \tabularnewline
16 & 13.88 & 14.6595 & 14.0041 & 0.655334 & -0.779459 \tabularnewline
17 & 14.78 & 14.1763 & 14.525 & -0.348694 & 0.603735 \tabularnewline
18 & 17.07 & 15.0971 & 14.795 & 0.302126 & 1.97287 \tabularnewline
19 & 16.29 & 14.489 & 14.9479 & -0.458957 & 1.80104 \tabularnewline
20 & 16.85 & 14.8726 & 15.0788 & -0.206103 & 1.97735 \tabularnewline
21 & 16.44 & 15.1783 & 15.2425 & -0.0641658 & 1.26167 \tabularnewline
22 & 15.4 & 15.2758 & 15.4908 & -0.215062 & 0.124228 \tabularnewline
23 & 14.86 & 15.4815 & 15.6712 & -0.18978 & -0.62147 \tabularnewline
24 & 13.36 & 15.2523 & 15.7171 & -0.464832 & -1.89225 \tabularnewline
25 & 14.17 & 15.8025 & 15.72 & 0.0825217 & -1.63252 \tabularnewline
26 & 14.73 & 16.0023 & 15.7287 & 0.273584 & -1.27233 \tabularnewline
27 & 16.53 & 16.4044 & 15.7704 & 0.634029 & 0.125555 \tabularnewline
28 & 16.94 & 16.6478 & 15.9925 & 0.655334 & 0.292166 \tabularnewline
29 & 16.05 & 16.0755 & 16.4242 & -0.348694 & -0.0254731 \tabularnewline
30 & 16.9 & 17.2905 & 16.9883 & 0.302126 & -0.390459 \tabularnewline
31 & 16.53 & 17.2523 & 17.7112 & -0.458957 & -0.722293 \tabularnewline
32 & 16.82 & 18.2735 & 18.4796 & -0.206103 & -1.45348 \tabularnewline
33 & 17.47 & 19.0908 & 19.155 & -0.0641658 & -1.62083 \tabularnewline
34 & 19.7 & 19.5979 & 19.8129 & -0.215062 & 0.102145 \tabularnewline
35 & 20.92 & 20.2698 & 20.4596 & -0.18978 & 0.650197 \tabularnewline
36 & 20.84 & 20.5723 & 21.0371 & -0.464832 & 0.267749 \tabularnewline
37 & 24.04 & 21.6438 & 21.5612 & 0.0825217 & 2.39623 \tabularnewline
38 & 23.3 & 22.4086 & 22.135 & 0.273584 & 0.891416 \tabularnewline
39 & 24.17 & 23.4453 & 22.8112 & 0.634029 & 0.724721 \tabularnewline
40 & 25.09 & 24.0678 & 23.4125 & 0.655334 & 1.02217 \tabularnewline
41 & 23.42 & 23.4634 & 23.8121 & -0.348694 & -0.0433898 \tabularnewline
42 & 23.39 & 24.4375 & 24.1354 & 0.302126 & -1.04754 \tabularnewline
43 & 22.62 & 23.8548 & 24.3138 & -0.458957 & -1.23479 \tabularnewline
44 & 24.5 & 24.1843 & 24.3904 & -0.206103 & 0.315687 \tabularnewline
45 & 26.02 & 24.3829 & 24.4471 & -0.0641658 & 1.63708 \tabularnewline
46 & 25.58 & 24.1812 & 24.3963 & -0.215062 & 1.39881 \tabularnewline
47 & 24.63 & 24.2211 & 24.4108 & -0.18978 & 0.408947 \tabularnewline
48 & 24.89 & 24.0298 & 24.4946 & -0.464832 & 0.860249 \tabularnewline
49 & 24.27 & 24.6221 & 24.5396 & 0.0825217 & -0.352105 \tabularnewline
50 & 24.91 & NA & NA & 0.273584 & NA \tabularnewline
51 & 23.92 & NA & NA & 0.634029 & NA \tabularnewline
52 & 24.12 & NA & NA & 0.655334 & NA \tabularnewline
53 & 24.74 & NA & NA & -0.348694 & NA \tabularnewline
54 & 24.08 & NA & NA & 0.302126 & NA \tabularnewline
55 & 23.01 & NA & NA & -0.458957 & NA \tabularnewline
\hline
\end{tabular}
%Source: https://freestatistics.org/blog/index.php?pk=316119&T=1

[TABLE]
[ROW][C]Classical Decomposition by Moving Averages[/C][/ROW]
[ROW][C]t[/C][C]Observations[/C][C]Fit[/C][C]Trend[/C][C]Seasonal[/C][C]Random[/C][/ROW]
[ROW][C]1[/C][C]1[/C][C]NA[/C][C]NA[/C][C]0.0825217[/C][C]NA[/C][/ROW]
[ROW][C]2[/C][C]0.91[/C][C]NA[/C][C]NA[/C][C]0.273584[/C][C]NA[/C][/ROW]
[ROW][C]3[/C][C]2.17[/C][C]NA[/C][C]NA[/C][C]0.634029[/C][C]NA[/C][/ROW]
[ROW][C]4[/C][C]3.112[/C][C]NA[/C][C]NA[/C][C]0.655334[/C][C]NA[/C][/ROW]
[ROW][C]5[/C][C]3.823[/C][C]NA[/C][C]NA[/C][C]-0.348694[/C][C]NA[/C][/ROW]
[ROW][C]6[/C][C]5.608[/C][C]NA[/C][C]NA[/C][C]0.302126[/C][C]NA[/C][/ROW]
[ROW][C]7[/C][C]6.428[/C][C]5.55879[/C][C]6.01775[/C][C]-0.458957[/C][C]0.869207[/C][/ROW]
[ROW][C]8[/C][C]6.679[/C][C]6.8054[/C][C]7.0115[/C][C]-0.206103[/C][C]-0.126397[/C][/ROW]
[ROW][C]9[/C][C]7.393[/C][C]7.95775[/C][C]8.02192[/C][C]-0.0641658[/C][C]-0.564751[/C][/ROW]
[ROW][C]10[/C][C]7.821[/C][C]8.73302[/C][C]8.94808[/C][C]-0.215062[/C][C]-0.912022[/C][/ROW]
[ROW][C]11[/C][C]9.939[/C][C]9.66351[/C][C]9.85329[/C][C]-0.18978[/C][C]0.275489[/C][/ROW]
[ROW][C]12[/C][C]11.8[/C][C]10.3226[/C][C]10.7874[/C][C]-0.464832[/C][C]1.47742[/C][/ROW]
[ROW][C]13[/C][C]12.06[/C][C]11.7584[/C][C]11.6759[/C][C]0.0825217[/C][C]0.301562[/C][/ROW]
[ROW][C]14[/C][C]13.7[/C][C]12.7842[/C][C]12.5106[/C][C]0.273584[/C][C]0.915791[/C][/ROW]
[ROW][C]15[/C][C]13.63[/C][C]13.9454[/C][C]13.3114[/C][C]0.634029[/C][C]-0.315404[/C][/ROW]
[ROW][C]16[/C][C]13.88[/C][C]14.6595[/C][C]14.0041[/C][C]0.655334[/C][C]-0.779459[/C][/ROW]
[ROW][C]17[/C][C]14.78[/C][C]14.1763[/C][C]14.525[/C][C]-0.348694[/C][C]0.603735[/C][/ROW]
[ROW][C]18[/C][C]17.07[/C][C]15.0971[/C][C]14.795[/C][C]0.302126[/C][C]1.97287[/C][/ROW]
[ROW][C]19[/C][C]16.29[/C][C]14.489[/C][C]14.9479[/C][C]-0.458957[/C][C]1.80104[/C][/ROW]
[ROW][C]20[/C][C]16.85[/C][C]14.8726[/C][C]15.0788[/C][C]-0.206103[/C][C]1.97735[/C][/ROW]
[ROW][C]21[/C][C]16.44[/C][C]15.1783[/C][C]15.2425[/C][C]-0.0641658[/C][C]1.26167[/C][/ROW]
[ROW][C]22[/C][C]15.4[/C][C]15.2758[/C][C]15.4908[/C][C]-0.215062[/C][C]0.124228[/C][/ROW]
[ROW][C]23[/C][C]14.86[/C][C]15.4815[/C][C]15.6712[/C][C]-0.18978[/C][C]-0.62147[/C][/ROW]
[ROW][C]24[/C][C]13.36[/C][C]15.2523[/C][C]15.7171[/C][C]-0.464832[/C][C]-1.89225[/C][/ROW]
[ROW][C]25[/C][C]14.17[/C][C]15.8025[/C][C]15.72[/C][C]0.0825217[/C][C]-1.63252[/C][/ROW]
[ROW][C]26[/C][C]14.73[/C][C]16.0023[/C][C]15.7287[/C][C]0.273584[/C][C]-1.27233[/C][/ROW]
[ROW][C]27[/C][C]16.53[/C][C]16.4044[/C][C]15.7704[/C][C]0.634029[/C][C]0.125555[/C][/ROW]
[ROW][C]28[/C][C]16.94[/C][C]16.6478[/C][C]15.9925[/C][C]0.655334[/C][C]0.292166[/C][/ROW]
[ROW][C]29[/C][C]16.05[/C][C]16.0755[/C][C]16.4242[/C][C]-0.348694[/C][C]-0.0254731[/C][/ROW]
[ROW][C]30[/C][C]16.9[/C][C]17.2905[/C][C]16.9883[/C][C]0.302126[/C][C]-0.390459[/C][/ROW]
[ROW][C]31[/C][C]16.53[/C][C]17.2523[/C][C]17.7112[/C][C]-0.458957[/C][C]-0.722293[/C][/ROW]
[ROW][C]32[/C][C]16.82[/C][C]18.2735[/C][C]18.4796[/C][C]-0.206103[/C][C]-1.45348[/C][/ROW]
[ROW][C]33[/C][C]17.47[/C][C]19.0908[/C][C]19.155[/C][C]-0.0641658[/C][C]-1.62083[/C][/ROW]
[ROW][C]34[/C][C]19.7[/C][C]19.5979[/C][C]19.8129[/C][C]-0.215062[/C][C]0.102145[/C][/ROW]
[ROW][C]35[/C][C]20.92[/C][C]20.2698[/C][C]20.4596[/C][C]-0.18978[/C][C]0.650197[/C][/ROW]
[ROW][C]36[/C][C]20.84[/C][C]20.5723[/C][C]21.0371[/C][C]-0.464832[/C][C]0.267749[/C][/ROW]
[ROW][C]37[/C][C]24.04[/C][C]21.6438[/C][C]21.5612[/C][C]0.0825217[/C][C]2.39623[/C][/ROW]
[ROW][C]38[/C][C]23.3[/C][C]22.4086[/C][C]22.135[/C][C]0.273584[/C][C]0.891416[/C][/ROW]
[ROW][C]39[/C][C]24.17[/C][C]23.4453[/C][C]22.8112[/C][C]0.634029[/C][C]0.724721[/C][/ROW]
[ROW][C]40[/C][C]25.09[/C][C]24.0678[/C][C]23.4125[/C][C]0.655334[/C][C]1.02217[/C][/ROW]
[ROW][C]41[/C][C]23.42[/C][C]23.4634[/C][C]23.8121[/C][C]-0.348694[/C][C]-0.0433898[/C][/ROW]
[ROW][C]42[/C][C]23.39[/C][C]24.4375[/C][C]24.1354[/C][C]0.302126[/C][C]-1.04754[/C][/ROW]
[ROW][C]43[/C][C]22.62[/C][C]23.8548[/C][C]24.3138[/C][C]-0.458957[/C][C]-1.23479[/C][/ROW]
[ROW][C]44[/C][C]24.5[/C][C]24.1843[/C][C]24.3904[/C][C]-0.206103[/C][C]0.315687[/C][/ROW]
[ROW][C]45[/C][C]26.02[/C][C]24.3829[/C][C]24.4471[/C][C]-0.0641658[/C][C]1.63708[/C][/ROW]
[ROW][C]46[/C][C]25.58[/C][C]24.1812[/C][C]24.3963[/C][C]-0.215062[/C][C]1.39881[/C][/ROW]
[ROW][C]47[/C][C]24.63[/C][C]24.2211[/C][C]24.4108[/C][C]-0.18978[/C][C]0.408947[/C][/ROW]
[ROW][C]48[/C][C]24.89[/C][C]24.0298[/C][C]24.4946[/C][C]-0.464832[/C][C]0.860249[/C][/ROW]
[ROW][C]49[/C][C]24.27[/C][C]24.6221[/C][C]24.5396[/C][C]0.0825217[/C][C]-0.352105[/C][/ROW]
[ROW][C]50[/C][C]24.91[/C][C]NA[/C][C]NA[/C][C]0.273584[/C][C]NA[/C][/ROW]
[ROW][C]51[/C][C]23.92[/C][C]NA[/C][C]NA[/C][C]0.634029[/C][C]NA[/C][/ROW]
[ROW][C]52[/C][C]24.12[/C][C]NA[/C][C]NA[/C][C]0.655334[/C][C]NA[/C][/ROW]
[ROW][C]53[/C][C]24.74[/C][C]NA[/C][C]NA[/C][C]-0.348694[/C][C]NA[/C][/ROW]
[ROW][C]54[/C][C]24.08[/C][C]NA[/C][C]NA[/C][C]0.302126[/C][C]NA[/C][/ROW]
[ROW][C]55[/C][C]23.01[/C][C]NA[/C][C]NA[/C][C]-0.458957[/C][C]NA[/C][/ROW]
[/TABLE]
Source: https://freestatistics.org/blog/index.php?pk=316119&T=1

Globally Unique Identifier (entire table): ba.freestatistics.org/blog/index.php?pk=316119&T=1

As an alternative you can also use a QR Code:  

The GUIDs for individual cells are displayed in the table below:

Classical Decomposition by Moving Averages
tObservationsFitTrendSeasonalRandom
11NANA0.0825217NA
20.91NANA0.273584NA
32.17NANA0.634029NA
43.112NANA0.655334NA
53.823NANA-0.348694NA
65.608NANA0.302126NA
76.4285.558796.01775-0.4589570.869207
86.6796.80547.0115-0.206103-0.126397
97.3937.957758.02192-0.0641658-0.564751
107.8218.733028.94808-0.215062-0.912022
119.9399.663519.85329-0.189780.275489
1211.810.322610.7874-0.4648321.47742
1312.0611.758411.67590.08252170.301562
1413.712.784212.51060.2735840.915791
1513.6313.945413.31140.634029-0.315404
1613.8814.659514.00410.655334-0.779459
1714.7814.176314.525-0.3486940.603735
1817.0715.097114.7950.3021261.97287
1916.2914.48914.9479-0.4589571.80104
2016.8514.872615.0788-0.2061031.97735
2116.4415.178315.2425-0.06416581.26167
2215.415.275815.4908-0.2150620.124228
2314.8615.481515.6712-0.18978-0.62147
2413.3615.252315.7171-0.464832-1.89225
2514.1715.802515.720.0825217-1.63252
2614.7316.002315.72870.273584-1.27233
2716.5316.404415.77040.6340290.125555
2816.9416.647815.99250.6553340.292166
2916.0516.075516.4242-0.348694-0.0254731
3016.917.290516.98830.302126-0.390459
3116.5317.252317.7112-0.458957-0.722293
3216.8218.273518.4796-0.206103-1.45348
3317.4719.090819.155-0.0641658-1.62083
3419.719.597919.8129-0.2150620.102145
3520.9220.269820.4596-0.189780.650197
3620.8420.572321.0371-0.4648320.267749
3724.0421.643821.56120.08252172.39623
3823.322.408622.1350.2735840.891416
3924.1723.445322.81120.6340290.724721
4025.0924.067823.41250.6553341.02217
4123.4223.463423.8121-0.348694-0.0433898
4223.3924.437524.13540.302126-1.04754
4322.6223.854824.3138-0.458957-1.23479
4424.524.184324.3904-0.2061030.315687
4526.0224.382924.4471-0.06416581.63708
4625.5824.181224.3963-0.2150621.39881
4724.6324.221124.4108-0.189780.408947
4824.8924.029824.4946-0.4648320.860249
4924.2724.622124.53960.0825217-0.352105
5024.91NANA0.273584NA
5123.92NANA0.634029NA
5224.12NANA0.655334NA
5324.74NANA-0.348694NA
5424.08NANA0.302126NA
5523.01NANA-0.458957NA


Parameters (Session):
Parameters (R input):
par1 = additive ; par2 = 12 ;
R code (references can be found in the software module):
par2 <- as.numeric(par2)
x <- ts(x,freq=par2)
m <- decompose(x,type=par1)
m$figure
bitmap(file='test1.png')
plot(m)
dev.off()
mylagmax <- length(x)/2
bitmap(file='test2.png')
op <- par(mfrow = c(2,2))
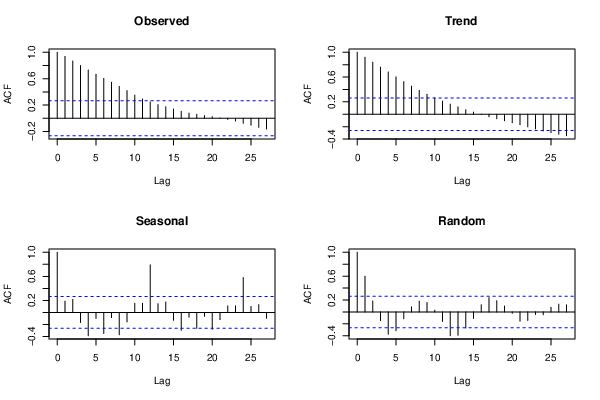
acf(as.numeric(x),lag.max = mylagmax,main='Observed')
acf(as.numeric(m$trend),na.action=na.pass,lag.max = mylagmax,main='Trend')
acf(as.numeric(m$seasonal),na.action=na.pass,lag.max = mylagmax,main='Seasonal')
acf(as.numeric(m$random),na.action=na.pass,lag.max = mylagmax,main='Random')
par(op)
dev.off()
bitmap(file='test3.png')
op <- par(mfrow = c(2,2))
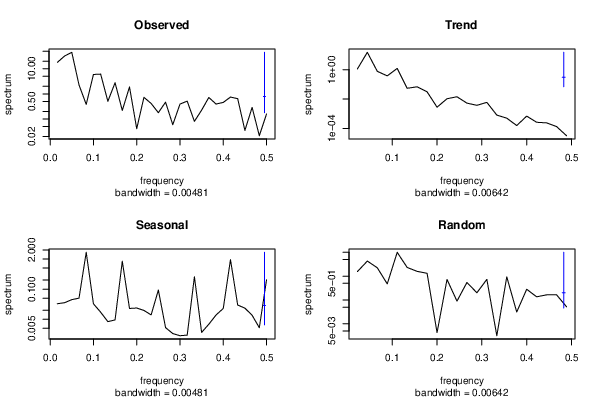
spectrum(as.numeric(x),main='Observed')
spectrum(as.numeric(m$trend[!is.na(m$trend)]),main='Trend')
spectrum(as.numeric(m$seasonal[!is.na(m$seasonal)]),main='Seasonal')
spectrum(as.numeric(m$random[!is.na(m$random)]),main='Random')
par(op)
dev.off()
bitmap(file='test4.png')
op <- par(mfrow = c(2,2))
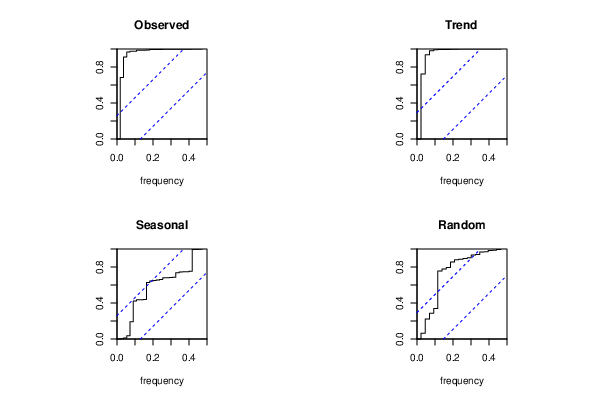
cpgram(as.numeric(x),main='Observed')
cpgram(as.numeric(m$trend[!is.na(m$trend)]),main='Trend')
cpgram(as.numeric(m$seasonal[!is.na(m$seasonal)]),main='Seasonal')
cpgram(as.numeric(m$random[!is.na(m$random)]),main='Random')
par(op)
dev.off()
load(file='createtable')
a<-table.start()
a<-table.row.start(a)
a<-table.element(a,'Classical Decomposition by Moving Averages',6,TRUE)
a<-table.row.end(a)
a<-table.row.start(a)
a<-table.element(a,'t',header=TRUE)
a<-table.element(a,'Observations',header=TRUE)
a<-table.element(a,'Fit',header=TRUE)
a<-table.element(a,'Trend',header=TRUE)
a<-table.element(a,'Seasonal',header=TRUE)
a<-table.element(a,'Random',header=TRUE)
a<-table.row.end(a)
for (i in 1:length(m$trend)) {
a<-table.row.start(a)
a<-table.element(a,i,header=TRUE)
a<-table.element(a,x[i])
if (par1 == 'additive') a<-table.element(a,signif(m$trend[i]+m$seasonal[i],6)) else a<-table.element(a,signif(m$trend[i]*m$seasonal[i],6))
a<-table.element(a,signif(m$trend[i],6))
a<-table.element(a,signif(m$seasonal[i],6))
a<-table.element(a,signif(m$random[i],6))
a<-table.row.end(a)
}
a<-table.end(a)
table.save(a,file='mytable.tab')