| Tabulation of Results | |||||||
| sugars x weight | |||||||
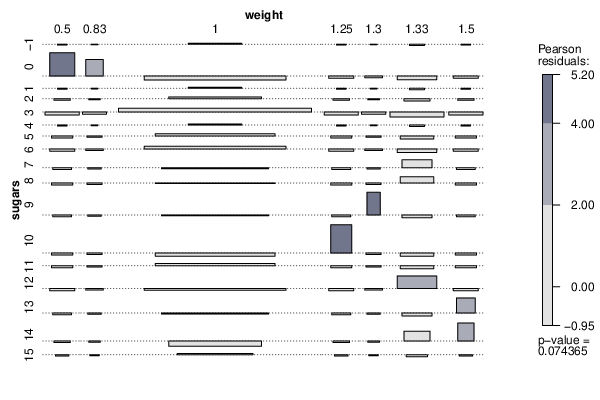
| 0.5 | 0.83 | 1 | 1.25 | 1.3 | 1.33 | 1.5 | -1 | 0 | 0 | 1 | 0 | 0 | 0 | 0 | 0 | 2 | 1 | 4 | 0 | 0 | 0 | 0 | 1 | 0 | 0 | 1 | 0 | 0 | 0 | 0 | 2 | 0 | 0 | 3 | 0 | 0 | 0 | 0 | 3 | 0 | 0 | 13 | 0 | 0 | 0 | 0 | 4 | 0 | 0 | 1 | 0 | 0 | 0 | 0 | 5 | 0 | 0 | 5 | 0 | 0 | 0 | 0 | 6 | 0 | 0 | 7 | 0 | 0 | 0 | 0 | 7 | 0 | 0 | 3 | 0 | 0 | 1 | 0 | 8 | 0 | 0 | 4 | 0 | 0 | 1 | 0 | 9 | 0 | 0 | 3 | 0 | 1 | 0 | 0 | 10 | 0 | 0 | 3 | 2 | 0 | 0 | 0 | 11 | 0 | 0 | 5 | 0 | 0 | 0 | 0 | 12 | 0 | 0 | 5 | 0 | 0 | 2 | 0 | 13 | 0 | 0 | 3 | 0 | 0 | 0 | 1 | 14 | 0 | 0 | 1 | 0 | 0 | 1 | 1 | 15 | 0 | 0 | 2 | 0 | 0 | 0 | 0 |
| Tabulation of Expected Results | |||||||
| sugars x weight | |||||||
| 0.5 | 0.83 | 1 | 1.25 | 1.3 | 1.33 | 1.5 | -1 | 0.03 | 0.01 | 0.83 | 0.03 | 0.01 | 0.06 | 0.03 | 0 | 0.18 | 0.09 | 5.82 | 0.18 | 0.09 | 0.45 | 0.18 | 1 | 0.03 | 0.01 | 0.83 | 0.03 | 0.01 | 0.06 | 0.03 | 2 | 0.08 | 0.04 | 2.49 | 0.08 | 0.04 | 0.19 | 0.08 | 3 | 0.34 | 0.17 | 10.81 | 0.34 | 0.17 | 0.84 | 0.34 | 4 | 0.03 | 0.01 | 0.83 | 0.03 | 0.01 | 0.06 | 0.03 | 5 | 0.13 | 0.06 | 4.16 | 0.13 | 0.06 | 0.32 | 0.13 | 6 | 0.18 | 0.09 | 5.82 | 0.18 | 0.09 | 0.45 | 0.18 | 7 | 0.1 | 0.05 | 3.32 | 0.1 | 0.05 | 0.26 | 0.1 | 8 | 0.13 | 0.06 | 4.16 | 0.13 | 0.06 | 0.32 | 0.13 | 9 | 0.1 | 0.05 | 3.32 | 0.1 | 0.05 | 0.26 | 0.1 | 10 | 0.13 | 0.06 | 4.16 | 0.13 | 0.06 | 0.32 | 0.13 | 11 | 0.13 | 0.06 | 4.16 | 0.13 | 0.06 | 0.32 | 0.13 | 12 | 0.18 | 0.09 | 5.82 | 0.18 | 0.09 | 0.45 | 0.18 | 13 | 0.1 | 0.05 | 3.32 | 0.1 | 0.05 | 0.26 | 0.1 | 14 | 0.08 | 0.04 | 2.49 | 0.08 | 0.04 | 0.19 | 0.08 | 15 | 0.05 | 0.03 | 1.66 | 0.05 | 0.03 | 0.13 | 0.05 |
| Statistical Results | |
| Pearson's Chi-squared test | |
| Pearson Chi Square Statistic | 116.68 |
| Degrees of Freedom | 96 |
| P value | 0.07 |