| Tabulation of Results | |||
| weight x vitamins | |||
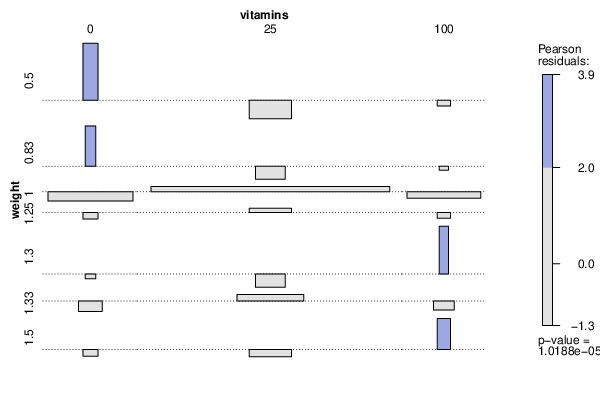
| 0 | 25 | 100 | 0.5 | 2 | 0 | 0 | 0.83 | 1 | 0 | 0 | 1 | 5 | 55 | 4 | 1.25 | 0 | 2 | 0 | 1.3 | 0 | 0 | 1 | 1.33 | 0 | 5 | 0 | 1.5 | 0 | 1 | 1 |
| Tabulation of Expected Results | |||
| weight x vitamins | |||
| 0 | 25 | 100 | 0.5 | 0.21 | 1.64 | 0.16 | 0.83 | 0.1 | 0.82 | 0.08 | 1 | 6.65 | 52.36 | 4.99 | 1.25 | 0.21 | 1.64 | 0.16 | 1.3 | 0.1 | 0.82 | 0.08 | 1.33 | 0.52 | 4.09 | 0.39 | 1.5 | 0.21 | 1.64 | 0.16 |
| Statistical Results | |
| Pearson's Chi-squared test | |
| Pearson Chi Square Statistic | 45.03 |
| Degrees of Freedom | 12 |
| P value | 0 |