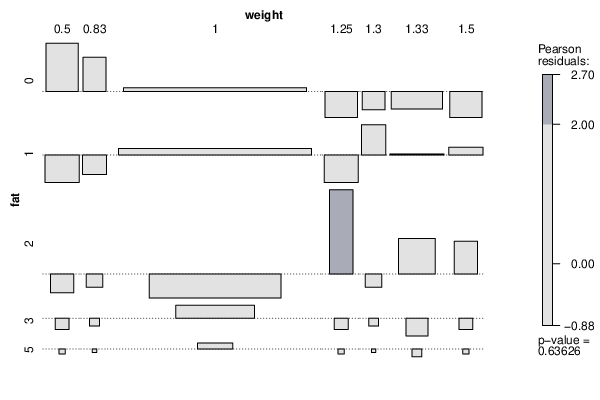
| Tabulation of Results | |||||||
| fat x weight | |||||||
| 0.5 | 0.83 | 1 | 1.25 | 1.3 | 1.33 | 1.5 | 0 | 2 | 1 | 23 | 0 | 0 | 1 | 0 | 1 | 0 | 0 | 26 | 0 | 1 | 2 | 1 | 2 | 0 | 0 | 9 | 2 | 0 | 2 | 1 | 3 | 0 | 0 | 5 | 0 | 0 | 0 | 0 | 5 | 0 | 0 | 1 | 0 | 0 | 0 | 0 |
| Tabulation of Expected Results | |||||||
| fat x weight | |||||||
| 0.5 | 0.83 | 1 | 1.25 | 1.3 | 1.33 | 1.5 | 0 | 0.7 | 0.35 | 22.44 | 0.7 | 0.35 | 1.75 | 0.7 | 1 | 0.78 | 0.39 | 24.94 | 0.78 | 0.39 | 1.95 | 0.78 | 2 | 0.36 | 0.18 | 11.64 | 0.36 | 0.18 | 0.91 | 0.36 | 3 | 0.13 | 0.06 | 4.16 | 0.13 | 0.06 | 0.32 | 0.13 | 5 | 0.03 | 0.01 | 0.83 | 0.03 | 0.01 | 0.06 | 0.03 |
| Statistical Results | |
| Pearson's Chi-squared test | |
| Pearson Chi Square Statistic | 21.04 |
| Degrees of Freedom | 24 |
| P value | 0.64 |