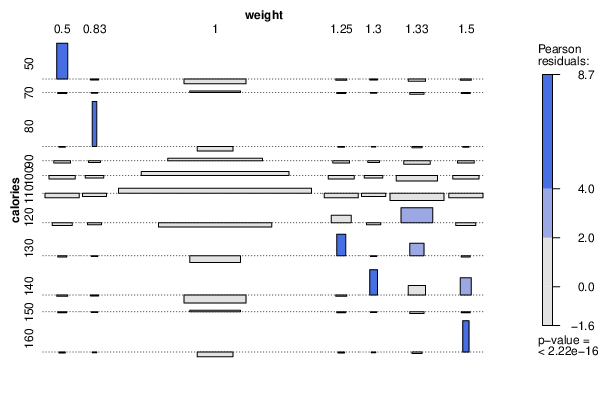
| Tabulation of Results | |||||||
| calories x weight | |||||||
| 0.5 | 0.83 | 1 | 1.25 | 1.3 | 1.33 | 1.5 | 50 | 2 | 0 | 1 | 0 | 0 | 0 | 0 | 70 | 0 | 0 | 2 | 0 | 0 | 0 | 0 | 80 | 0 | 1 | 0 | 0 | 0 | 0 | 0 | 90 | 0 | 0 | 7 | 0 | 0 | 0 | 0 | 100 | 0 | 0 | 17 | 0 | 0 | 0 | 0 | 110 | 0 | 0 | 29 | 0 | 0 | 0 | 0 | 120 | 0 | 0 | 6 | 1 | 0 | 3 | 0 | 130 | 0 | 0 | 0 | 1 | 0 | 1 | 0 | 140 | 0 | 0 | 0 | 0 | 1 | 1 | 1 | 150 | 0 | 0 | 2 | 0 | 0 | 0 | 0 | 160 | 0 | 0 | 0 | 0 | 0 | 0 | 1 |
| Tabulation of Expected Results | |||||||
| calories x weight | |||||||
| 0.5 | 0.83 | 1 | 1.25 | 1.3 | 1.33 | 1.5 | 50 | 0.08 | 0.04 | 2.49 | 0.08 | 0.04 | 0.19 | 0.08 | 70 | 0.05 | 0.03 | 1.66 | 0.05 | 0.03 | 0.13 | 0.05 | 80 | 0.03 | 0.01 | 0.83 | 0.03 | 0.01 | 0.06 | 0.03 | 90 | 0.18 | 0.09 | 5.82 | 0.18 | 0.09 | 0.45 | 0.18 | 100 | 0.44 | 0.22 | 14.13 | 0.44 | 0.22 | 1.1 | 0.44 | 110 | 0.75 | 0.38 | 24.1 | 0.75 | 0.38 | 1.88 | 0.75 | 120 | 0.26 | 0.13 | 8.31 | 0.26 | 0.13 | 0.65 | 0.26 | 130 | 0.05 | 0.03 | 1.66 | 0.05 | 0.03 | 0.13 | 0.05 | 140 | 0.08 | 0.04 | 2.49 | 0.08 | 0.04 | 0.19 | 0.08 | 150 | 0.05 | 0.03 | 1.66 | 0.05 | 0.03 | 0.13 | 0.05 | 160 | 0.03 | 0.01 | 0.83 | 0.03 | 0.01 | 0.06 | 0.03 |
| Statistical Results | |
| Pearson's Chi-squared test | |
| Pearson Chi Square Statistic | 251.44 |
| Degrees of Freedom | 60 |
| P value | 0 |