| Multiple Linear Regression - Estimated Regression Equation |
| LFM[t] = + 30162.6 + 14.6135Calculation[t] + 16.9147Algebraic_Reasoning[t] -9.74093Graphical_Interpretation[t] -0.137477Proportionality_and_Ratio[t] -0.461622Probability_and_Sampling[t] -14.9508year[t] + 42.0478group[t] -7.39408gender[t] + e[t] |
| Multiple Linear Regression - Ordinary Least Squares | |||||
| Variable | Parameter | S.D. | T-STAT H0: parameter = 0 | 2-tail p-value | 1-tail p-value |
| (Intercept) | +3.016e+04 | 8377 | +3.6010e+00 | 0.000378 | 0.000189 |
| Calculation | +14.61 | 13.48 | +1.0840e+00 | 0.2794 | 0.1397 |
| Algebraic_Reasoning | +16.91 | 12.82 | +1.3200e+00 | 0.1881 | 0.09404 |
| Graphical_Interpretation | -9.741 | 10.01 | -9.7290e-01 | 0.3315 | 0.1657 |
| Proportionality_and_Ratio | -0.1375 | 6.282 | -2.1880e-02 | 0.9826 | 0.4913 |
| Probability_and_Sampling | -0.4616 | 6.028 | -7.6580e-02 | 0.939 | 0.4695 |
| year | -14.95 | 4.165 | -3.5900e+00 | 0.0003928 | 0.0001964 |
| group | +42.05 | 4.151 | +1.0130e+01 | 1.225e-20 | 6.125e-21 |
| gender | -7.394 | 4.319 | -1.7120e+00 | 0.08803 | 0.04401 |
| Multiple Linear Regression - Regression Statistics | |
| Multiple R | 0.5673 |
| R-squared | 0.3218 |
| Adjusted R-squared | 0.3016 |
| F-TEST (value) | 15.95 |
| F-TEST (DF numerator) | 8 |
| F-TEST (DF denominator) | 269 |
| p-value | 0 |
| Multiple Linear Regression - Residual Statistics | |
| Residual Standard Deviation | 33.29 |
| Sum Squared Residuals | 2.981e+05 |
| Menu of Residual Diagnostics | |
| Description | Link |
| Histogram | Compute |
| Central Tendency | Compute |
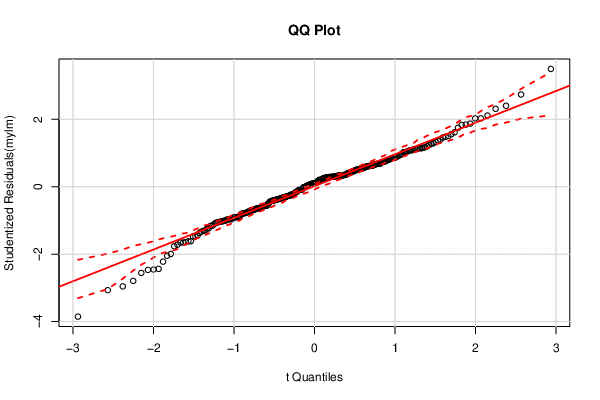
| QQ Plot | Compute |
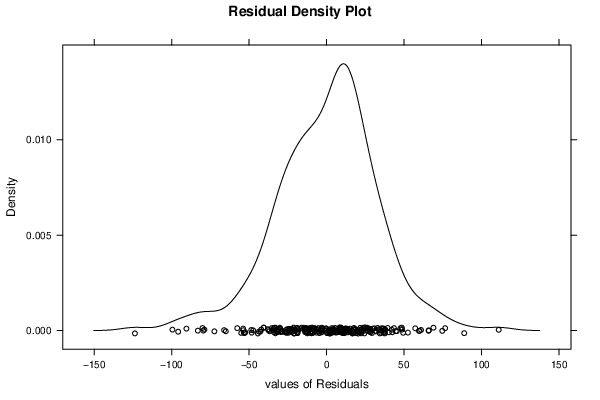
| Kernel Density Plot | Compute |
| Skewness/Kurtosis Test | Compute |
| Skewness-Kurtosis Plot | Compute |
| Harrell-Davis Plot | Compute |
| Bootstrap Plot -- Central Tendency | Compute |
| Blocked Bootstrap Plot -- Central Tendency | Compute |
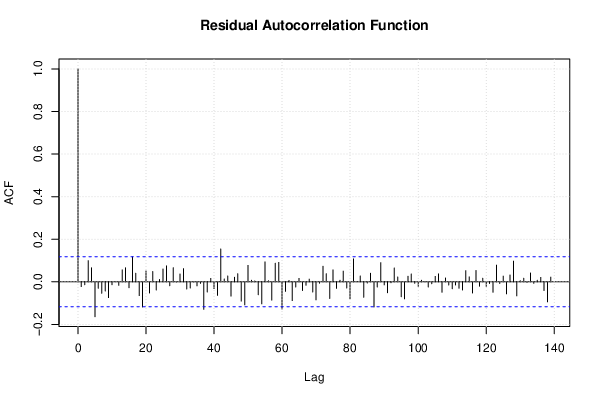
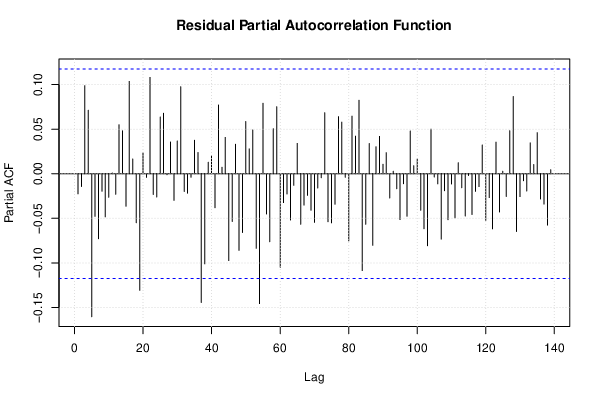
| (Partial) Autocorrelation Plot | Compute |
| Spectral Analysis | Compute |
| Tukey lambda PPCC Plot | Compute |
| Box-Cox Normality Plot | Compute |
| Summary Statistics | Compute |
| Ramsey RESET F-Test for powers (2 and 3) of fitted values |
> reset_test_fitted RESET test data: mylm RESET = 1.3706, df1 = 2, df2 = 267, p-value = 0.2557 |
| Ramsey RESET F-Test for powers (2 and 3) of regressors |
> reset_test_regressors RESET test data: mylm RESET = 1.1259, df1 = 16, df2 = 253, p-value = 0.3311 |
| Ramsey RESET F-Test for powers (2 and 3) of principal components |
> reset_test_principal_components RESET test data: mylm RESET = 0.54701, df1 = 2, df2 = 267, p-value = 0.5793 |
| Variance Inflation Factors (Multicollinearity) |
> vif
              Calculation       Algebraic_Reasoning  Graphical_Interpretation
                 1.476674                  1.528567                  1.456389
Proportionality_and_Ratio  Probability_and_Sampling                      year
                 1.231042                  1.241168                  1.046628
                    group                    gender
                 1.080197                  1.147848
|