| Multiple Linear Regression - Estimated Regression Equation |
| LFM[t] = + 87.5711 + 21.25Calculation[t] + 20.8481Algebraic_Reasoning[t] -13.7184Graphical_Interpretation[t] -2.45875Probability_and_Sampling[t] -1.58339Proportionality_and_Ratio[t] -5.2563Estimation[t] + 42.8534group[t] -6.52554gender[t] + e[t] |
| Multiple Linear Regression - Ordinary Least Squares | |||||
| Variable | Parameter | S.D. | T-STAT H0: parameter = 0 | 2-tail p-value | 1-tail p-value |
| (Intercept) | +87.57 | 10.08 | +8.6870e+00 | 3.681e-16 | 1.84e-16 |
| Calculation | +21.25 | 13.96 | +1.5220e+00 | 0.1293 | 0.06463 |
| Algebraic_Reasoning | +20.85 | 13.11 | +1.5900e+00 | 0.1129 | 0.05646 |
| Graphical_Interpretation | -13.72 | 10.2 | -1.3450e+00 | 0.1797 | 0.08985 |
| Probability_and_Sampling | -2.459 | 6.138 | -4.0060e-01 | 0.689 | 0.3445 |
| Proportionality_and_Ratio | -1.583 | 6.427 | -2.4640e-01 | 0.8056 | 0.4028 |
| Estimation | -5.256 | 5.702 | -9.2180e-01 | 0.3574 | 0.1787 |
| group | +42.85 | 4.241 | +1.0100e+01 | 1.481e-20 | 7.405e-21 |
| gender | -6.526 | 4.407 | -1.4810e+00 | 0.1398 | 0.06991 |
| Multiple Linear Regression - Regression Statistics | |
| Multiple R | 0.5399 |
| R-squared | 0.2915 |
| Adjusted R-squared | 0.2705 |
| F-TEST (value) | 13.84 |
| F-TEST (DF numerator) | 8 |
| F-TEST (DF denominator) | 269 |
| p-value | 0 |
| Multiple Linear Regression - Residual Statistics | |
| Residual Standard Deviation | 34.02 |
| Sum Squared Residuals | 3.114e+05 |
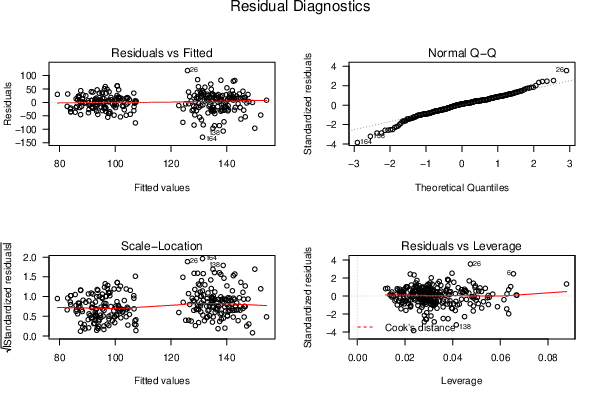
| Menu of Residual Diagnostics | |
| Description | Link |
| Histogram | Compute |
| Central Tendency | Compute |
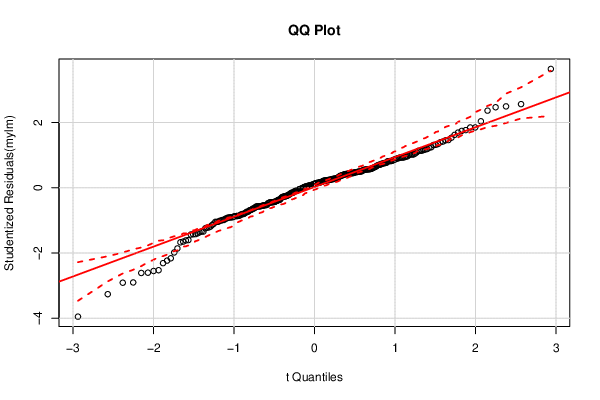
| QQ Plot | Compute |
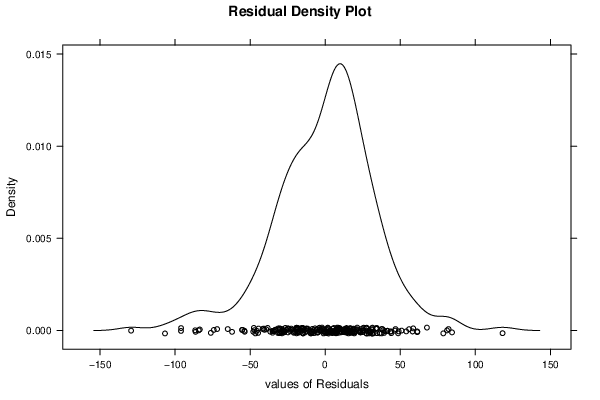
| Kernel Density Plot | Compute |
| Skewness/Kurtosis Test | Compute |
| Skewness-Kurtosis Plot | Compute |
| Harrell-Davis Plot | Compute |
| Bootstrap Plot -- Central Tendency | Compute |
| Blocked Bootstrap Plot -- Central Tendency | Compute |
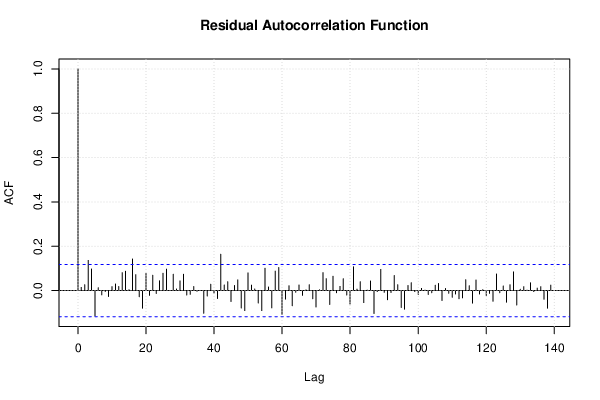
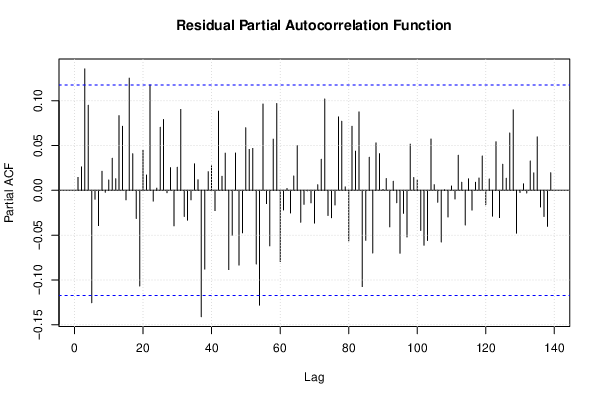
| (Partial) Autocorrelation Plot | Compute |
| Spectral Analysis | Compute |
| Tukey lambda PPCC Plot | Compute |
| Box-Cox Normality Plot | Compute |
| Summary Statistics | Compute |
| Ramsey RESET F-Test for powers (2 and 3) of fitted values |
> reset_test_fitted RESET test data: mylm RESET = 0.041469, df1 = 2, df2 = 267, p-value = 0.9594 |
| Ramsey RESET F-Test for powers (2 and 3) of regressors |
> reset_test_regressors RESET test data: mylm RESET = 1.0678, df1 = 16, df2 = 253, p-value = 0.3865 |
| Ramsey RESET F-Test for powers (2 and 3) of principal components |
> reset_test_principal_components RESET test data: mylm RESET = 0.41084, df1 = 2, df2 = 267, p-value = 0.6635 |
| Variance Inflation Factors (Multicollinearity) |
> vif
              Calculation       Algebraic_Reasoning  Graphical_Interpretation
                 1.516202                  1.530479                  1.446530
 Probability_and_Sampling Proportionality_and_Ratio                Estimation
                 1.231737                  1.233344                  1.176489
                    group                    gender
                 1.079533                  1.144033
|