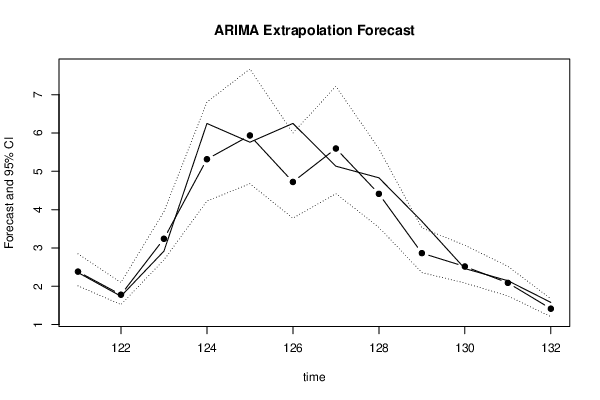
| Univariate ARIMA Extrapolation Forecast | ||||||||
| time | Y[t] | F[t] | 95% LB | 95% UB | p-value (H0: Y[t] = F[t]) | P(F[t]>Y[t-1]) | P(F[t]>Y[t-s]) | P(F[t]>Y[120]) |
| 108 | 1.169 | - | - | - | - | - | - | - |
| 109 | 2.429 | - | - | - | - | - | - | - |
| 110 | 1.762 | - | - | - | - | - | - | - |
| 111 | 2.846 | - | - | - | - | - | - | - |
| 112 | 5.627 | - | - | - | - | - | - | - |
| 113 | 5.749 | - | - | - | - | - | - | - |
| 114 | 4.502 | - | - | - | - | - | - | - |
| 115 | 5.72 | - | - | - | - | - | - | - |
| 116 | 4.403 | - | - | - | - | - | - | - |
| 117 | 2.867 | - | - | - | - | - | - | - |
| 118 | 2.635 | - | - | - | - | - | - | - |
| 119 | 2.059 | - | - | - | - | - | - | - |
| 120 | 1.511 | - | - | - | - | - | - | - |
| 121 | 2.359 | 2.3827 | 2.0114 | 2.8483 | 0.4602 | 0.9999 | 0.4228 | 0.9999 |
| 122 | 1.741 | 1.7799 | 1.5224 | 2.0969 | 0.4051 | 2e-04 | 0.5439 | 0.9517 |
| 123 | 2.917 | 3.2396 | 2.6881 | 3.9476 | 0.1859 | 1 | 0.862 | 1 |
| 124 | 6.249 | 5.3166 | 4.2232 | 6.8083 | 0.1103 | 0.9992 | 0.3417 | 1 |
| 125 | 5.76 | 5.9358 | 4.6776 | 7.6719 | 0.4213 | 0.3618 | 0.5835 | 1 |
| 126 | 6.25 | 4.7232 | 3.7782 | 6.0001 | 0.0095 | 0.0557 | 0.6329 | 1 |
| 127 | 5.134 | 5.5954 | 4.4171 | 7.2173 | 0.2885 | 0.2145 | 0.4402 | 1 |
| 128 | 4.831 | 4.4125 | 3.5381 | 5.59 | 0.243 | 0.1149 | 0.5063 | 1 |
| 129 | 3.695 | 2.8648 | 2.3576 | 3.5237 | 0.0068 | 0 | 0.4974 | 1 |
| 130 | 2.462 | 2.5162 | 2.0853 | 3.0705 | 0.424 | 0 | 0.3372 | 0.9998 |
| 131 | 2.146 | 2.0895 | 1.7489 | 2.5217 | 0.3989 | 0.0456 | 0.555 | 0.9957 |
| 132 | 1.579 | 1.4152 | 1.2074 | 1.6721 | 0.1057 | 0 | 0.2324 | 0.2324 |
| Univariate ARIMA Extrapolation Forecast Performance | |||||||||
| time | % S.E. | PE | MAPE | sMAPE | Sq.E | MSE | RMSE | ScaledE | MASE |
| 121 | 0.0997 | -0.0101 | 0.0101 | 0.01 | 6e-04 | 0 | 0 | -0.0242 | 0.0242 |
| 122 | 0.0909 | -0.0223 | 0.0162 | 0.016 | 0.0015 | 0.001 | 0.0322 | -0.0397 | 0.0319 |
| 123 | 0.1115 | -0.1106 | 0.0477 | 0.0456 | 0.104 | 0.0354 | 0.1881 | -0.3293 | 0.131 |
| 124 | 0.1432 | 0.1492 | 0.073 | 0.0745 | 0.8694 | 0.2439 | 0.4939 | 0.9518 | 0.3362 |
| 125 | 0.1492 | -0.0305 | 0.0645 | 0.0656 | 0.0309 | 0.2013 | 0.4487 | -0.1795 | 0.3049 |
| 126 | 0.1379 | 0.2443 | 0.0945 | 0.1011 | 2.3311 | 0.5563 | 0.7458 | 1.5585 | 0.5138 |
| 127 | 0.1479 | -0.0899 | 0.0938 | 0.0989 | 0.2129 | 0.5072 | 0.7122 | -0.471 | 0.5077 |
| 128 | 0.1362 | 0.0866 | 0.0929 | 0.0979 | 0.1751 | 0.4657 | 0.6824 | 0.4272 | 0.4977 |
| 129 | 0.1173 | 0.2247 | 0.1076 | 0.1151 | 0.6892 | 0.4905 | 0.7004 | 0.8474 | 0.5365 |
| 130 | 0.1124 | -0.022 | 0.099 | 0.1058 | 0.0029 | 0.4418 | 0.6647 | -0.0554 | 0.4884 |
| 131 | 0.1055 | 0.0263 | 0.0924 | 0.0986 | 0.0032 | 0.4019 | 0.634 | 0.0577 | 0.4492 |
| 132 | 0.0926 | 0.1037 | 0.0934 | 0.0995 | 0.0268 | 0.3706 | 0.6088 | 0.1672 | 0.4257 |