| Tabulation of Results | ||
| group x gender | ||
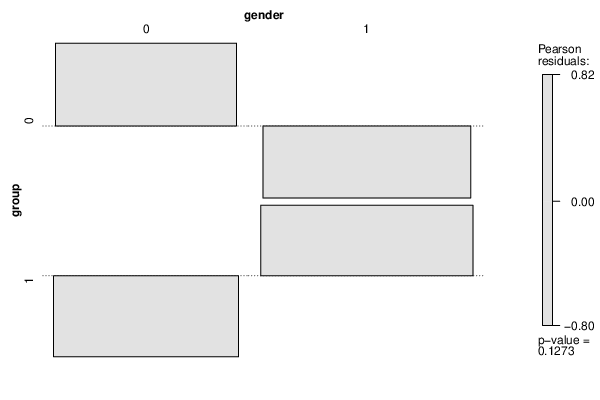
| 0 | 1 | 0 | 65 | 71 | 1 | 55 | 87 |
| Tabulation of Expected Results | ||
| group x gender | ||
| 0 | 1 | 0 | 58.71 | 77.29 | 1 | 61.29 | 80.71 |
| Statistical Results | |
| Pearson's Chi-squared test with Yates' continuity correction | |
| Pearson Chi Square Statistic | 1.97 |
| Degrees of Freedom | 1 |
| P value | 0.16 |