| Multiple Linear Regression - Estimated Regression Equation |
| bouwvergunningen[t] = + 2313.48 + 20.6506M1[t] + 65.7494M2[t] -160.052M3[t] + 64.2469M4[t] + 362.275M5[t] + 209.585M6[t] + 562.117M7[t] + 401.649M8[t] + 194.293M9[t] + 381.491M10[t] + 88.1346M11[t] -5.19877t + e[t] |
| Multiple Linear Regression - Ordinary Least Squares | |||||
| Variable | Parameter | S.D. | T-STAT H0: parameter = 0 | 2-tail p-value | 1-tail p-value |
| (Intercept) | +2314 | 153.8 | +1.5040e+01 | 2.542e-27 | 1.271e-27 |
| M1 | +20.65 | 187.6 | +1.1010e-01 | 0.9126 | 0.4563 |
| M2 | +65.75 | 187.6 | +3.5050e-01 | 0.7267 | 0.3634 |
| M3 | -160.1 | 187.6 | -8.5330e-01 | 0.3955 | 0.1978 |
| M4 | +64.25 | 187.5 | +3.4260e-01 | 0.7326 | 0.3663 |
| M5 | +362.3 | 192.6 | +1.8810e+00 | 0.06289 | 0.03144 |
| M6 | +209.6 | 192.5 | +1.0890e+00 | 0.279 | 0.1395 |
| M7 | +562.1 | 192.5 | +2.9200e+00 | 0.004332 | 0.002166 |
| M8 | +401.6 | 192.5 | +2.0870e+00 | 0.03946 | 0.01973 |
| M9 | +194.3 | 192.4 | +1.0100e+00 | 0.3151 | 0.1576 |
| M10 | +381.5 | 192.4 | +1.9830e+00 | 0.05018 | 0.02509 |
| M11 | +88.14 | 192.4 | +4.5810e-01 | 0.6479 | 0.324 |
| t | -5.199 | 1.195 | -4.3500e+00 | 3.308e-05 | 1.654e-05 |
| Multiple Linear Regression - Regression Statistics | |
| Multiple R | 0.5672 |
| R-squared | 0.3217 |
| Adjusted R-squared | 0.2395 |
| F-TEST (value) | 3.913 |
| F-TEST (DF numerator) | 12 |
| F-TEST (DF denominator) | 99 |
| p-value | 6.442e-05 |
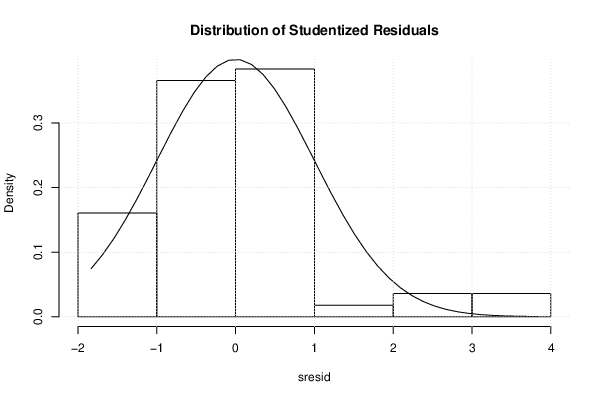
| Multiple Linear Regression - Residual Statistics | |
| Residual Standard Deviation | 408.1 |
| Sum Squared Residuals | 1.649e+07 |
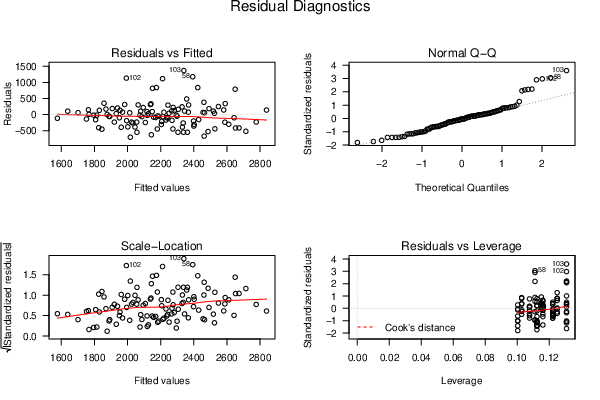
| Menu of Residual Diagnostics | |
| Description | Link |
| Histogram | Compute |
| Central Tendency | Compute |
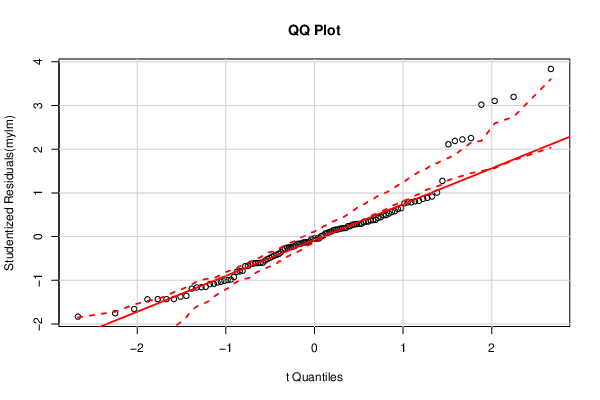
| QQ Plot | Compute |
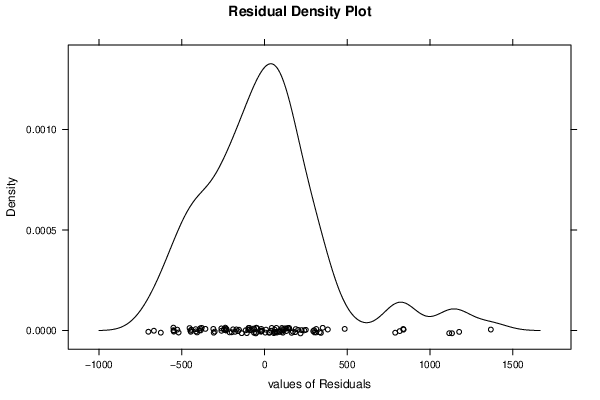
| Kernel Density Plot | Compute |
| Skewness/Kurtosis Test | Compute |
| Skewness-Kurtosis Plot | Compute |
| Harrell-Davis Plot | Compute |
| Bootstrap Plot -- Central Tendency | Compute |
| Blocked Bootstrap Plot -- Central Tendency | Compute |
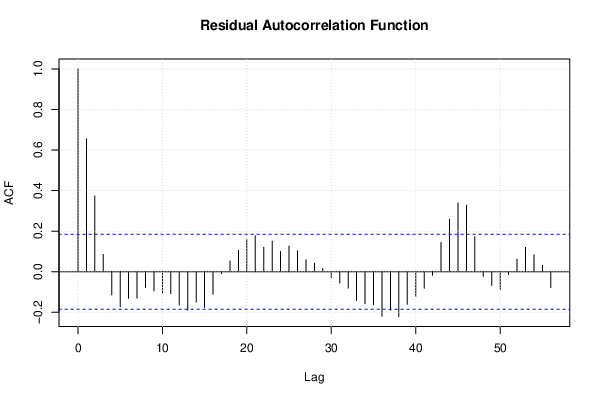
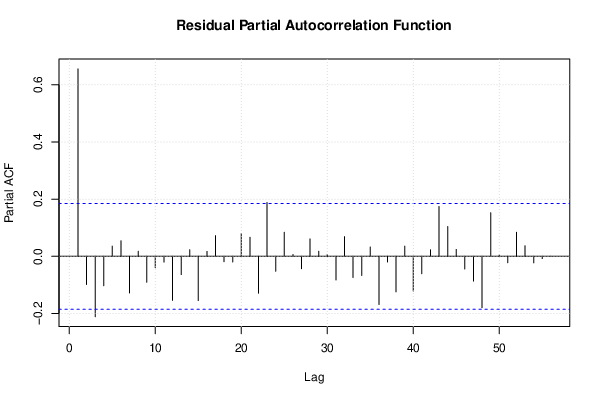
| (Partial) Autocorrelation Plot | Compute |
| Spectral Analysis | Compute |
| Tukey lambda PPCC Plot | Compute |
| Box-Cox Normality Plot | Compute |
| Summary Statistics | Compute |
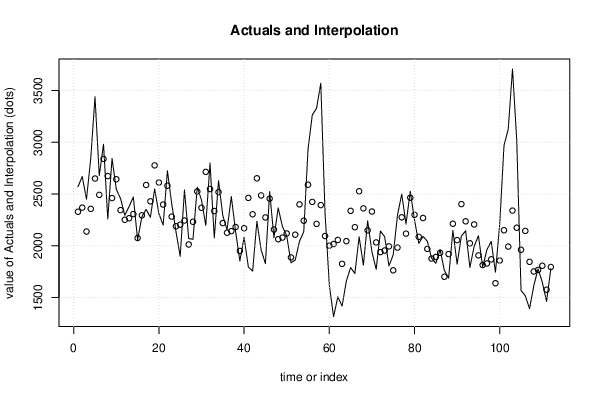
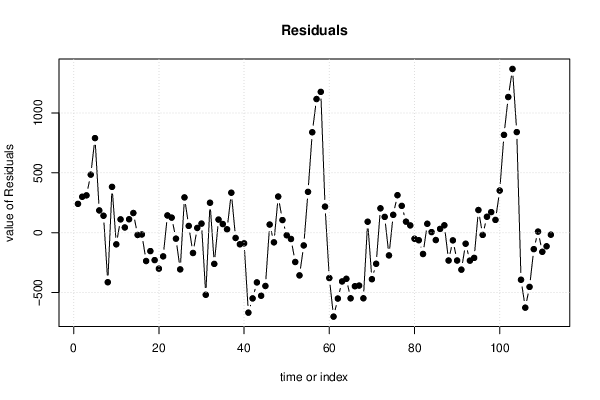
| Multiple Linear Regression - Actuals, Interpolation, and Residuals | |||
| Time or Index | Actuals | Interpolation Forecast | Residuals Prediction Error |
| 1 | 2570 | 2329 | 241.1 |
| 2 | 2669 | 2369 | 300.2 |
| 3 | 2450 | 2138 | 312.2 |
| 4 | 2842 | 2357 | 485.1 |
| 5 | 3440 | 2650 | 790.2 |
| 6 | 2678 | 2492 | 186.1 |
| 7 | 2981 | 2839 | 141.8 |
| 8 | 2260 | 2674 | -413.5 |
| 9 | 2844 | 2461 | 383 |
| 10 | 2546 | 2643 | -96.99 |
| 11 | 2456 | 2344 | 111.6 |
| 12 | 2295 | 2251 | 43.9 |
| 13 | 2379 | 2267 | 112.5 |
| 14 | 2471 | 2306 | 164.6 |
| 15 | 2057 | 2075 | -18.45 |
| 16 | 2280 | 2295 | -14.55 |
| 17 | 2351 | 2587 | -236.4 |
| 18 | 2276 | 2429 | -153.5 |
| 19 | 2548 | 2777 | -228.8 |
| 20 | 2311 | 2611 | -300.2 |
| 21 | 2201 | 2399 | -197.6 |
| 22 | 2725 | 2581 | 144.4 |
| 23 | 2408 | 2282 | 126 |
| 24 | 2139 | 2189 | -49.71 |
| 25 | 1898 | 2204 | -306.2 |
| 26 | 2539 | 2244 | 294.9 |
| 27 | 2070 | 2013 | 56.94 |
| 28 | 2063 | 2232 | -169.2 |
| 29 | 2565 | 2525 | 40.01 |
| 30 | 2443 | 2367 | 75.9 |
| 31 | 2196 | 2714 | -518.4 |
| 32 | 2799 | 2549 | 250.2 |
| 33 | 2076 | 2336 | -260.2 |
| 34 | 2628 | 2518 | 109.8 |
| 35 | 2292 | 2220 | 72.34 |
| 36 | 2155 | 2126 | 28.67 |
| 37 | 2476 | 2142 | 334.2 |
| 38 | 2138 | 2182 | -43.68 |
| 39 | 1854 | 1951 | -96.68 |
| 40 | 2081 | 2170 | -88.78 |
| 41 | 1795 | 2463 | -667.6 |
| 42 | 1756 | 2305 | -548.7 |
| 43 | 2237 | 2652 | -415.1 |
| 44 | 1960 | 2486 | -526.4 |
| 45 | 1829 | 2274 | -444.8 |
| 46 | 2524 | 2456 | 68.17 |
| 47 | 2077 | 2157 | -80.27 |
| 48 | 2366 | 2064 | 302.1 |
| 49 | 2185 | 2079 | 105.6 |
| 50 | 2098 | 2119 | -21.29 |
| 51 | 1836 | 1888 | -52.29 |
| 52 | 1863 | 2107 | -244.4 |
| 53 | 2044 | 2400 | -356.2 |
| 54 | 2136 | 2242 | -106.3 |
| 55 | 2931 | 2590 | 341.3 |
| 56 | 3263 | 2424 | 839 |
| 57 | 3328 | 2211 | 1117 |
| 58 | 3570 | 2393 | 1177 |
| 59 | 2313 | 2095 | 218.1 |
| 60 | 1623 | 2002 | -378.6 |
| 61 | 1316 | 2017 | -701 |
| 62 | 1507 | 2057 | -549.9 |
| 63 | 1419 | 1826 | -406.9 |
| 64 | 1660 | 2045 | -385 |
| 65 | 1790 | 2338 | -547.8 |
| 66 | 1733 | 2180 | -446.9 |
| 67 | 2086 | 2527 | -441.3 |
| 68 | 1814 | 2362 | -547.6 |
| 69 | 2241 | 2149 | 91.94 |
| 70 | 1943 | 2331 | -388.1 |
| 71 | 1773 | 2032 | -259.5 |
| 72 | 2143 | 1939 | 203.8 |
| 73 | 2087 | 1955 | 132.4 |
| 74 | 1805 | 1995 | -189.5 |
| 75 | 1913 | 1764 | 149.5 |
| 76 | 2296 | 1983 | 313.4 |
| 77 | 2500 | 2275 | 224.5 |
| 78 | 2210 | 2118 | 92.44 |
| 79 | 2526 | 2465 | 61.1 |
| 80 | 2249 | 2299 | -50.23 |
| 81 | 2024 | 2087 | -62.67 |
| 82 | 2091 | 2269 | -177.7 |
| 83 | 2045 | 1970 | 74.88 |
| 84 | 1882 | 1877 | 5.215 |
| 85 | 1831 | 1892 | -61.24 |
| 86 | 1964 | 1932 | 31.86 |
| 87 | 1763 | 1701 | 61.86 |
| 88 | 1688 | 1920 | -232.2 |
| 89 | 2149 | 2213 | -64.07 |
| 90 | 1823 | 2055 | -232.2 |
| 91 | 2094 | 2403 | -308.5 |
| 92 | 2145 | 2237 | -91.84 |
| 93 | 1791 | 2024 | -233.3 |
| 94 | 1996 | 2206 | -210.3 |
| 95 | 2097 | 1908 | 189.3 |
| 96 | 1796 | 1814 | -18.4 |
| 97 | 1963 | 1830 | 133.1 |
| 98 | 2042 | 1870 | 172.2 |
| 99 | 1746 | 1639 | 107.2 |
| 100 | 2210 | 1858 | 352.1 |
| 101 | 2968 | 2151 | 817.3 |
| 102 | 3126 | 1993 | 1133 |
| 103 | 3708 | 2340 | 1368 |
| 104 | 3015 | 2174 | 840.5 |
| 105 | 1569 | 1962 | -392.9 |
| 106 | 1518 | 2144 | -625.9 |
| 107 | 1393 | 1845 | -452.3 |
| 108 | 1615 | 1752 | -137 |
| 109 | 1777 | 1767 | 9.533 |
| 110 | 1648 | 1807 | -159.4 |
| 111 | 1463 | 1576 | -113.4 |
| 112 | 1779 | 1795 | -16.47 |
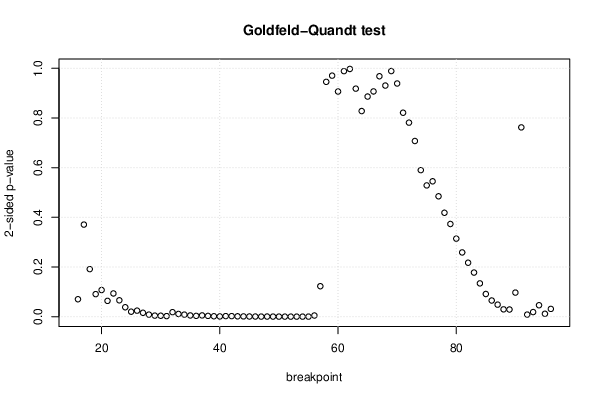
| Goldfeld-Quandt test for Heteroskedasticity | |||
| p-values | Alternative Hypothesis | ||
| breakpoint index | greater | 2-sided | less |
| 16 | 0.03511 | 0.07022 | 0.9649 |
| 17 | 0.1854 | 0.3708 | 0.8146 |
| 18 | 0.09574 | 0.1915 | 0.9043 |
| 19 | 0.04535 | 0.0907 | 0.9547 |
| 20 | 0.05361 | 0.1072 | 0.9464 |
| 21 | 0.03179 | 0.06358 | 0.9682 |
| 22 | 0.04673 | 0.09346 | 0.9533 |
| 23 | 0.03294 | 0.06587 | 0.9671 |
| 24 | 0.01896 | 0.03793 | 0.981 |
| 25 | 0.009995 | 0.01999 | 0.99 |
| 26 | 0.01205 | 0.0241 | 0.9879 |
| 27 | 0.007765 | 0.01553 | 0.9922 |
| 28 | 0.004102 | 0.008204 | 0.9959 |
| 29 | 0.002104 | 0.004207 | 0.9979 |
| 30 | 0.001807 | 0.003614 | 0.9982 |
| 31 | 0.001166 | 0.002333 | 0.9988 |
| 32 | 0.009029 | 0.01806 | 0.991 |
| 33 | 0.005446 | 0.01089 | 0.9946 |
| 34 | 0.004059 | 0.008119 | 0.9959 |
| 35 | 0.002455 | 0.00491 | 0.9975 |
| 36 | 0.001555 | 0.00311 | 0.9984 |
| 37 | 0.002516 | 0.005033 | 0.9975 |
| 38 | 0.001498 | 0.002997 | 0.9985 |
| 39 | 0.0008161 | 0.001632 | 0.9992 |
| 40 | 0.0004332 | 0.0008664 | 0.9996 |
| 41 | 0.001168 | 0.002337 | 0.9988 |
| 42 | 0.001051 | 0.002101 | 0.9989 |
| 43 | 0.0006786 | 0.001357 | 0.9993 |
| 44 | 0.0004942 | 0.0009883 | 0.9995 |
| 45 | 0.0003339 | 0.0006679 | 0.9997 |
| 46 | 0.0002394 | 0.0004787 | 0.9998 |
| 47 | 0.000128 | 0.0002561 | 0.9999 |
| 48 | 0.0002078 | 0.0004156 | 0.9998 |
| 49 | 0.0001565 | 0.0003129 | 0.9998 |
| 50 | 8.665e-05 | 0.0001733 | 0.9999 |
| 51 | 4.821e-05 | 9.642e-05 | 1 |
| 52 | 2.483e-05 | 4.967e-05 | 1 |
| 53 | 1.423e-05 | 2.846e-05 | 1 |
| 54 | 9.178e-06 | 1.836e-05 | 1 |
| 55 | 5.133e-05 | 0.0001027 | 0.9999 |
| 56 | 0.002315 | 0.00463 | 0.9977 |
| 57 | 0.0613 | 0.1226 | 0.9387 |
| 58 | 0.4728 | 0.9455 | 0.5272 |
| 59 | 0.4852 | 0.9705 | 0.5148 |
| 60 | 0.4533 | 0.9066 | 0.5467 |
| 61 | 0.5056 | 0.9887 | 0.4944 |
| 62 | 0.5012 | 0.9975 | 0.4988 |
| 63 | 0.4591 | 0.9182 | 0.5409 |
| 64 | 0.414 | 0.8279 | 0.586 |
| 65 | 0.4432 | 0.8863 | 0.5568 |
| 66 | 0.4535 | 0.907 | 0.5465 |
| 67 | 0.4841 | 0.9681 | 0.5159 |
| 68 | 0.5347 | 0.9306 | 0.4653 |
| 69 | 0.5055 | 0.989 | 0.4945 |
| 70 | 0.4695 | 0.9389 | 0.5305 |
| 71 | 0.4106 | 0.8212 | 0.5894 |
| 72 | 0.3906 | 0.7813 | 0.6094 |
| 73 | 0.3537 | 0.7074 | 0.6463 |
| 74 | 0.295 | 0.5901 | 0.705 |
| 75 | 0.2643 | 0.5285 | 0.7357 |
| 76 | 0.2726 | 0.5451 | 0.7274 |
| 77 | 0.2423 | 0.4847 | 0.7577 |
| 78 | 0.2092 | 0.4183 | 0.7908 |
| 79 | 0.1866 | 0.3732 | 0.8134 |
| 80 | 0.1571 | 0.3141 | 0.8429 |
| 81 | 0.1293 | 0.2587 | 0.8707 |
| 82 | 0.1086 | 0.2171 | 0.8914 |
| 83 | 0.08878 | 0.1776 | 0.9112 |
| 84 | 0.067 | 0.134 | 0.933 |
| 85 | 0.04561 | 0.09122 | 0.9544 |
| 86 | 0.03248 | 0.06497 | 0.9675 |
| 87 | 0.02418 | 0.04836 | 0.9758 |
| 88 | 0.01476 | 0.02951 | 0.9852 |
| 89 | 0.01439 | 0.02878 | 0.9856 |
| 90 | 0.04844 | 0.09689 | 0.9516 |
| 91 | 0.6189 | 0.7622 | 0.3811 |
| 92 | 0.9958 | 0.008354 | 0.004177 |
| 93 | 0.9908 | 0.01846 | 0.009228 |
| 94 | 0.9769 | 0.0461 | 0.02305 |
| 95 | 0.9943 | 0.01149 | 0.005746 |
| 96 | 0.9844 | 0.03117 | 0.01559 |
| Meta Analysis of Goldfeld-Quandt test for Heteroskedasticity | |||
| Description | # significant tests | % significant tests | OK/NOK |
| 1% type I error level | 28 | 0.3457 | NOK |
| 5% type I error level | 41 | 0.506173 | NOK |
| 10% type I error level | 49 | 0.604938 | NOK |
| Ramsey RESET F-Test for powers (2 and 3) of fitted values |
> reset_test_fitted RESET test data: mylm RESET = 0.50476, df1 = 2, df2 = 97, p-value = 0.6052 |
| Ramsey RESET F-Test for powers (2 and 3) of regressors |
> reset_test_regressors RESET test data: mylm RESET = 0.22388, df1 = 24, df2 = 75, p-value = 0.9999 |
| Ramsey RESET F-Test for powers (2 and 3) of principal components |
> reset_test_principal_components RESET test data: mylm RESET = 3.4746, df1 = 2, df2 = 97, p-value = 0.03488 |
| Variance Inflation Factors (Multicollinearity) |
> vif
      M1       M2       M3       M4       M5       M6       M7       M8
1.924571 1.923868 1.923322 1.922931 1.842763 1.841840 1.841060 1.840421
      M9      M10      M11        t
1.839924 1.839570 1.839357 1.003669
|