| Multiple Linear Regression - Estimated Regression Equation |
| Births[t] = + 9330.59 + 107.621M1[t] -635.532M2[t] -287.828M3[t] + 8.74534M4[t] -879.764M5[t] + 75.7257M6[t] -309.617M7[t] -141.294M8[t] -196.97M9[t] + 367.186M10[t] + 234.51M11[t] + 11.0098t + e[t] |
| Multiple Linear Regression - Ordinary Least Squares | |||||
| Variable | Parameter | S.D. | T-STAT H0: parameter = 0 | 2-tail p-value | 1-tail p-value |
| (Intercept) | +9331 | 136.4 | +6.8390e+01 | 4.209e-60 | 2.104e-60 |
| M1 | +107.6 | 163 | +6.6030e-01 | 0.5115 | 0.2558 |
| M2 | -635.5 | 162.9 | -3.9010e+00 | 0.0002384 | 0.0001192 |
| M3 | -287.8 | 162.9 | -1.7670e+00 | 0.0821 | 0.04105 |
| M4 | +8.745 | 169.4 | +5.1620e-02 | 0.959 | 0.4795 |
| M5 | -879.8 | 169.3 | -5.1970e+00 | 2.404e-06 | 1.202e-06 |
| M6 | +75.73 | 169.2 | +4.4750e-01 | 0.656 | 0.328 |
| M7 | -309.6 | 169.1 | -1.8310e+00 | 0.07195 | 0.03597 |
| M8 | -141.3 | 169.1 | -8.3580e-01 | 0.4065 | 0.2032 |
| M9 | -197 | 169 | -1.1650e+00 | 0.2483 | 0.1241 |
| M10 | +367.2 | 169 | +2.1730e+00 | 0.0336 | 0.0168 |
| M11 | +234.5 | 168.9 | +1.3880e+00 | 0.1701 | 0.08504 |
| t | +11.01 | 1.569 | +7.0170e+00 | 2.013e-09 | 1.006e-09 |
| Multiple Linear Regression - Regression Statistics | |
| Multiple R | 0.8465 |
| R-squared | 0.7165 |
| Adjusted R-squared | 0.6617 |
| F-TEST (value) | 13.06 |
| F-TEST (DF numerator) | 12 |
| F-TEST (DF denominator) | 62 |
| p-value | 8.078e-13 |
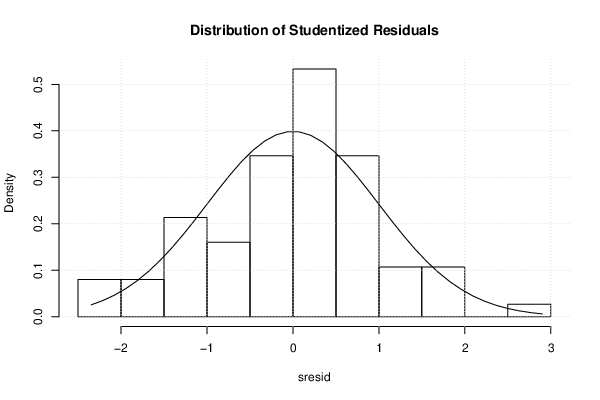
| Multiple Linear Regression - Residual Statistics | |
| Residual Standard Deviation | 292.6 |
| Sum Squared Residuals | 5.309e+06 |
| Menu of Residual Diagnostics | |
| Description | Link |
| Histogram | Compute |
| Central Tendency | Compute |
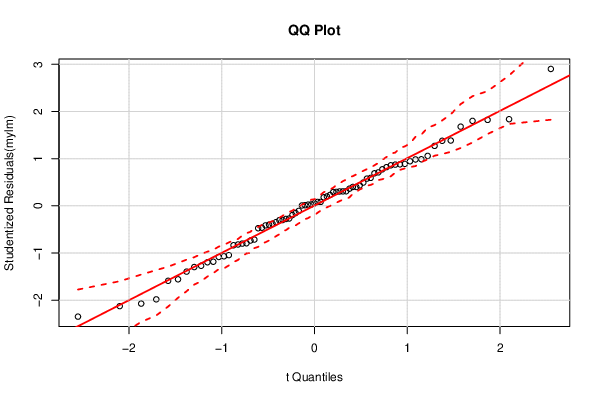
| QQ Plot | Compute |
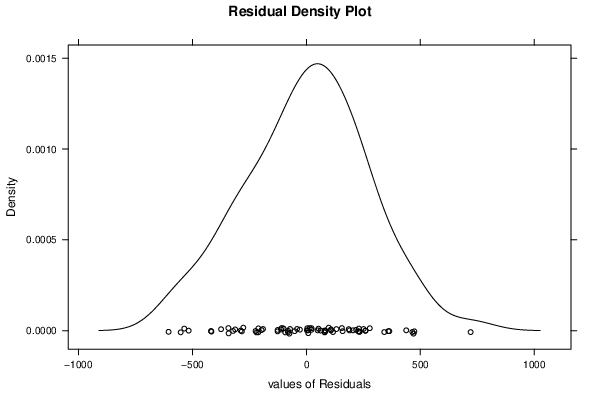
| Kernel Density Plot | Compute |
| Skewness/Kurtosis Test | Compute |
| Skewness-Kurtosis Plot | Compute |
| Harrell-Davis Plot | Compute |
| Bootstrap Plot -- Central Tendency | Compute |
| Blocked Bootstrap Plot -- Central Tendency | Compute |
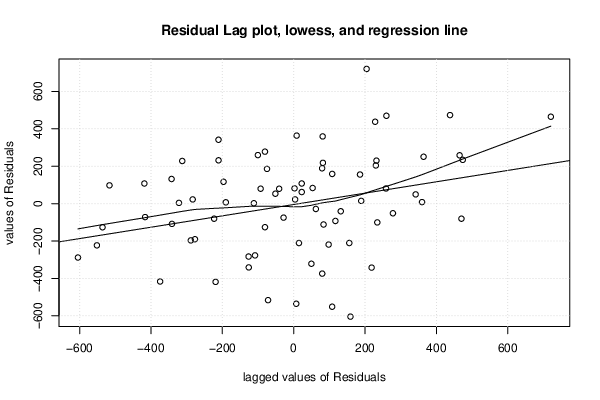
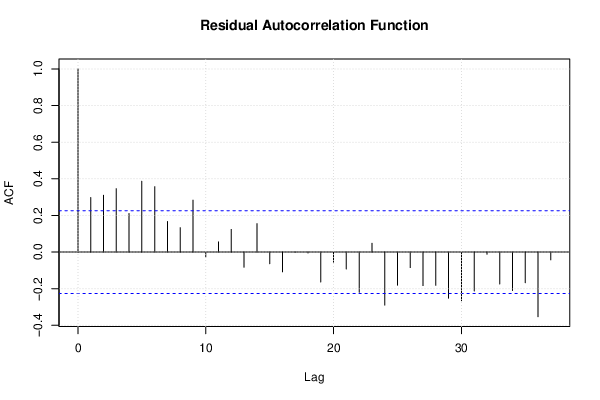
| (Partial) Autocorrelation Plot | Compute |
| Spectral Analysis | Compute |
| Tukey lambda PPCC Plot | Compute |
| Box-Cox Normality Plot | Compute |
| Summary Statistics | Compute |
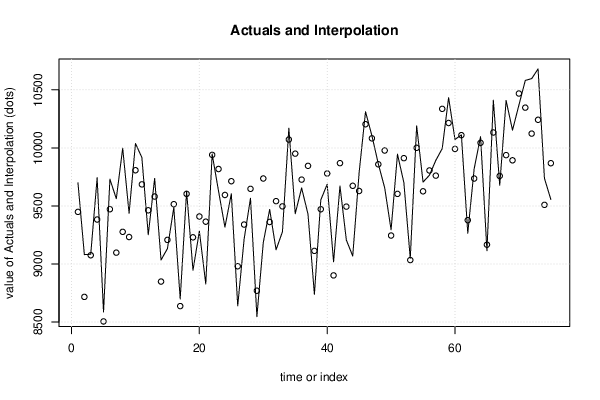
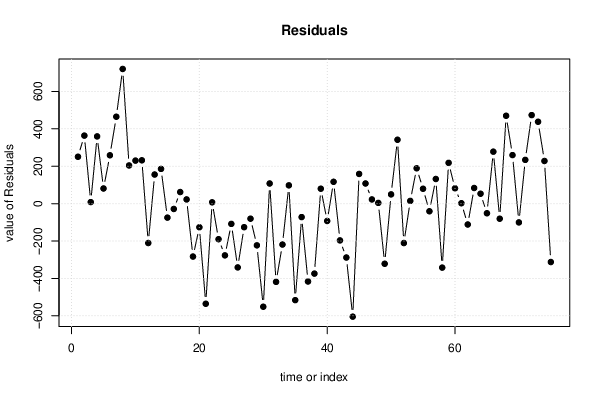
| Multiple Linear Regression - Actuals, Interpolation, and Residuals | |||
| Time or Index | Actuals | Interpolation Forecast | Residuals Prediction Error |
| 1 | 9700 | 9449 | 250.8 |
| 2 | 9081 | 8717 | 363.9 |
| 3 | 9084 | 9076 | 8.211 |
| 4 | 9743 | 9383 | 359.6 |
| 5 | 8587 | 8506 | 81.13 |
| 6 | 9731 | 9472 | 258.6 |
| 7 | 9563 | 9098 | 465 |
| 8 | 9998 | 9277 | 720.6 |
| 9 | 9437 | 9233 | 204.3 |
| 10 | 1.004e+04 | 9808 | 230.1 |
| 11 | 9918 | 9686 | 231.8 |
| 12 | 9252 | 9463 | -210.7 |
| 13 | 9737 | 9581 | 155.7 |
| 14 | 9035 | 8849 | 185.8 |
| 15 | 9133 | 9208 | -74.91 |
| 16 | 9487 | 9515 | -28.49 |
| 17 | 8700 | 8638 | 62.01 |
| 18 | 9627 | 9604 | 22.51 |
| 19 | 8947 | 9230 | -283.2 |
| 20 | 9283 | 9409 | -126.5 |
| 21 | 8829 | 9365 | -535.8 |
| 22 | 9947 | 9940 | 7.01 |
| 23 | 9628 | 9818 | -190.3 |
| 24 | 9318 | 9595 | -276.8 |
| 25 | 9605 | 9713 | -108.5 |
| 26 | 8640 | 8981 | -341.3 |
| 27 | 9214 | 9340 | -126 |
| 28 | 9567 | 9648 | -80.61 |
| 29 | 8547 | 8770 | -223.1 |
| 30 | 9185 | 9737 | -551.6 |
| 31 | 9470 | 9362 | 107.7 |
| 32 | 9123 | 9542 | -418.6 |
| 33 | 9278 | 9497 | -218.9 |
| 34 | 1.017e+04 | 1.007e+04 | 97.89 |
| 35 | 9434 | 9950 | -516.4 |
| 36 | 9655 | 9727 | -71.94 |
| 37 | 9429 | 9846 | -416.6 |
| 38 | 8739 | 9113 | -374.4 |
| 39 | 9552 | 9472 | 79.86 |
| 40 | 9687 | 9780 | -92.73 |
| 41 | 9019 | 8902 | 116.8 |
| 42 | 9672 | 9869 | -196.7 |
| 43 | 9206 | 9494 | -288.4 |
| 44 | 9069 | 9674 | -604.7 |
| 45 | 9788 | 9629 | 158.9 |
| 46 | 1.031e+04 | 1.02e+04 | 107.8 |
| 47 | 1.01e+04 | 1.008e+04 | 22.44 |
| 48 | 9863 | 9859 | 3.941 |
| 49 | 9656 | 9978 | -321.7 |
| 50 | 9295 | 9246 | 49.45 |
| 51 | 9946 | 9604 | 341.7 |
| 52 | 9701 | 9912 | -210.8 |
| 53 | 9049 | 9034 | 14.66 |
| 54 | 1.019e+04 | 1e+04 | 189.2 |
| 55 | 9706 | 9627 | 79.49 |
| 56 | 9765 | 9806 | -40.84 |
| 57 | 9893 | 9761 | 131.8 |
| 58 | 9994 | 1.034e+04 | -342.3 |
| 59 | 1.043e+04 | 1.021e+04 | 218.3 |
| 60 | 1.007e+04 | 9991 | 81.82 |
| 61 | 1.011e+04 | 1.011e+04 | 2.193 |
| 62 | 9266 | 9378 | -111.7 |
| 63 | 9820 | 9736 | 83.62 |
| 64 | 1.01e+04 | 1.004e+04 | 53.04 |
| 65 | 9115 | 9166 | -51.46 |
| 66 | 1.041e+04 | 1.013e+04 | 278 |
| 67 | 9678 | 9759 | -80.63 |
| 68 | 1.041e+04 | 9938 | 470 |
| 69 | 1.015e+04 | 9893 | 259.7 |
| 70 | 1.037e+04 | 1.047e+04 | -100.5 |
| 71 | 1.058e+04 | 1.035e+04 | 234.2 |
| 72 | 1.06e+04 | 1.012e+04 | 473.7 |
| 73 | 1.068e+04 | 1.024e+04 | 438.1 |
| 74 | 9738 | 9510 | 228.2 |
| 75 | 9556 | 9868 | -312.5 |
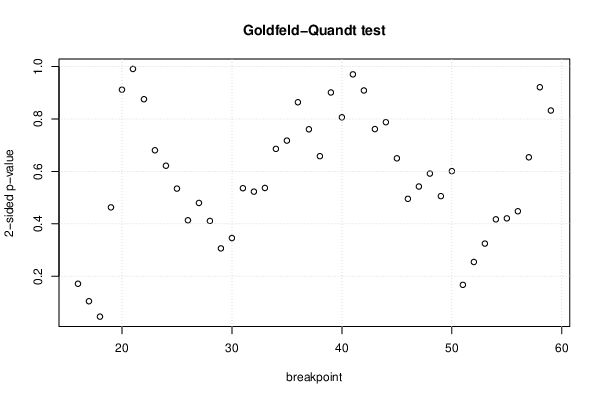
| Goldfeld-Quandt test for Heteroskedasticity | |||
| p-values | Alternative Hypothesis | ||
| breakpoint index | greater | 2-sided | less |
| 16 | 0.08579 | 0.1716 | 0.9142 |
| 17 | 0.0525 | 0.105 | 0.9475 |
| 18 | 0.0231 | 0.04621 | 0.9769 |
| 19 | 0.2315 | 0.463 | 0.7685 |
| 20 | 0.4558 | 0.9116 | 0.5442 |
| 21 | 0.5046 | 0.9908 | 0.4954 |
| 22 | 0.4377 | 0.8754 | 0.5623 |
| 23 | 0.3404 | 0.6807 | 0.6596 |
| 24 | 0.3109 | 0.6217 | 0.6891 |
| 25 | 0.2672 | 0.5345 | 0.7328 |
| 26 | 0.2069 | 0.4137 | 0.7932 |
| 27 | 0.2399 | 0.4798 | 0.7601 |
| 28 | 0.2056 | 0.4113 | 0.7944 |
| 29 | 0.1533 | 0.3065 | 0.8467 |
| 30 | 0.173 | 0.346 | 0.827 |
| 31 | 0.268 | 0.536 | 0.732 |
| 32 | 0.2614 | 0.5228 | 0.7386 |
| 33 | 0.2685 | 0.5369 | 0.7315 |
| 34 | 0.343 | 0.686 | 0.657 |
| 35 | 0.3588 | 0.7175 | 0.6412 |
| 36 | 0.4319 | 0.8638 | 0.5681 |
| 37 | 0.3804 | 0.7607 | 0.6196 |
| 38 | 0.3291 | 0.6582 | 0.6709 |
| 39 | 0.4505 | 0.901 | 0.5495 |
| 40 | 0.4032 | 0.8064 | 0.5968 |
| 41 | 0.4851 | 0.9702 | 0.5149 |
| 42 | 0.4543 | 0.9086 | 0.5457 |
| 43 | 0.3808 | 0.7615 | 0.6192 |
| 44 | 0.6061 | 0.7877 | 0.3939 |
| 45 | 0.675 | 0.65 | 0.325 |
| 46 | 0.7523 | 0.4954 | 0.2477 |
| 47 | 0.7288 | 0.5424 | 0.2712 |
| 48 | 0.7041 | 0.5917 | 0.2959 |
| 49 | 0.7471 | 0.5057 | 0.2529 |
| 50 | 0.6994 | 0.6012 | 0.3006 |
| 51 | 0.9162 | 0.1676 | 0.08378 |
| 52 | 0.8727 | 0.2546 | 0.1273 |
| 53 | 0.8376 | 0.3248 | 0.1624 |
| 54 | 0.7913 | 0.4174 | 0.2087 |
| 55 | 0.7895 | 0.421 | 0.2105 |
| 56 | 0.7759 | 0.4481 | 0.2241 |
| 57 | 0.6731 | 0.6539 | 0.3269 |
| 58 | 0.5395 | 0.9211 | 0.4605 |
| 59 | 0.4161 | 0.8322 | 0.5839 |
| Meta Analysis of Goldfeld-Quandt test for Heteroskedasticity | |||
| Description | # significant tests | % significant tests | OK/NOK |
| 1% type I error level | 0 | 0 | OK |
| 5% type I error level | 1 | 0.0227273 | OK |
| 10% type I error level | 1 | 0.0227273 | OK |
| Ramsey RESET F-Test for powers (2 and 3) of fitted values |
> reset_test_fitted RESET test data: mylm RESET = 1.3552, df1 = 2, df2 = 60, p-value = 0.2657 |
| Ramsey RESET F-Test for powers (2 and 3) of regressors |
> reset_test_regressors RESET test data: mylm RESET = 0.91359, df1 = 24, df2 = 38, p-value = 0.5849 |
| Ramsey RESET F-Test for powers (2 and 3) of principal components |
> reset_test_principal_components RESET test data: mylm RESET = 17.31, df1 = 2, df2 = 60, p-value = 1.161e-06 |
| Variance Inflation Factors (Multicollinearity) |
> vif
      M1       M2       M3       M4       M5       M6       M7       M8
1.969007 1.967364 1.966087 1.850159 1.847778 1.845714 1.843968 1.842540
      M9      M10      M11        t
1.841429 1.840635 1.840159 1.010755
|