| Multiple Linear Regression - Estimated Regression Equation |
| barrels_purchased[t] = -2603.29 -4583.16unit_price[t] + 570.576cpi[t] + 2.91625defl_tval[t] + 963.657US_IND_PROD[t] + 0.0979866`barrels_purchased(t-1)`[t] + 0.0536991`barrels_purchased(t-2)`[t] + 0.0725056`barrels_purchased(t-3)`[t] + 1527.25M1[t] + 6984.95M2[t] + 4303.15M3[t] + 6374.93M4[t] + 5928.51M5[t] + 121.357M6[t] + 2042.65M7[t] -2259.45M8[t] -2599.37M9[t] + 630.711M10[t] -12621.5M11[t] + 88.8446t + e[t] |
| Multiple Linear Regression - Ordinary Least Squares | |||||
| Variable | Parameter | S.D. | T-STAT H0: parameter = 0 | 2-tail p-value | 1-tail p-value |
| (Intercept) | -2603 | 1.868e+04 | -1.3940e-01 | 0.8892 | 0.4446 |
| unit_price | -4583 | 179.2 | -2.5580e+01 | 5.43e-86 | 2.715e-86 |
| cpi | +570.6 | 291.7 | +1.9560e+00 | 0.05119 | 0.02559 |
| defl_tval | +2.916 | 0.1104 | +2.6420e+01 | 1.756e-89 | 8.782e-90 |
| US_IND_PROD | +963.7 | 184.1 | +5.2360e+00 | 2.669e-07 | 1.335e-07 |
| `barrels_purchased(t-1)` | +0.09799 | 0.03061 | +3.2010e+00 | 0.001481 | 0.0007404 |
| `barrels_purchased(t-2)` | +0.0537 | 0.03089 | +1.7380e+00 | 0.08292 | 0.04146 |
| `barrels_purchased(t-3)` | +0.07251 | 0.02963 | +2.4470e+00 | 0.01484 | 0.00742 |
| M1 | +1527 | 2692 | +5.6730e-01 | 0.5709 | 0.2854 |
| M2 | +6985 | 2670 | +2.6160e+00 | 0.00923 | 0.004615 |
| M3 | +4303 | 2615 | +1.6460e+00 | 0.1006 | 0.05032 |
| M4 | +6375 | 2590 | +2.4610e+00 | 0.01428 | 0.007138 |
| M5 | +5928 | 2590 | +2.2890e+00 | 0.02259 | 0.0113 |
| M6 | +121.4 | 2641 | +4.5950e-02 | 0.9634 | 0.4817 |
| M7 | +2043 | 2511 | +8.1350e-01 | 0.4164 | 0.2082 |
| M8 | -2260 | 2607 | -8.6680e-01 | 0.3866 | 0.1933 |
| M9 | -2599 | 2502 | -1.0390e+00 | 0.2995 | 0.1497 |
| M10 | +630.7 | 2544 | +2.4800e-01 | 0.8043 | 0.4021 |
| M11 | -1.262e+04 | 2642 | -4.7770e+00 | 2.503e-06 | 1.252e-06 |
| t | +88.84 | 132.7 | +6.6930e-01 | 0.5037 | 0.2518 |
| Multiple Linear Regression - Regression Statistics | |
| Multiple R | 0.9901 |
| R-squared | 0.9804 |
| Adjusted R-squared | 0.9794 |
| F-TEST (value) | 1044 |
| F-TEST (DF numerator) | 19 |
| F-TEST (DF denominator) | 397 |
| p-value | 0 |
| Multiple Linear Regression - Residual Statistics | |
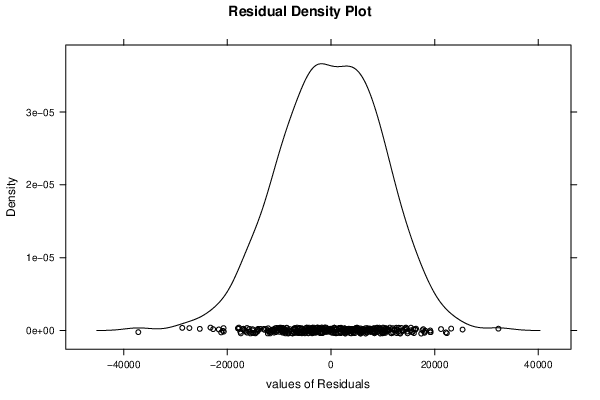
| Residual Standard Deviation | 1.016e+04 |
| Sum Squared Residuals | 4.098e+10 |
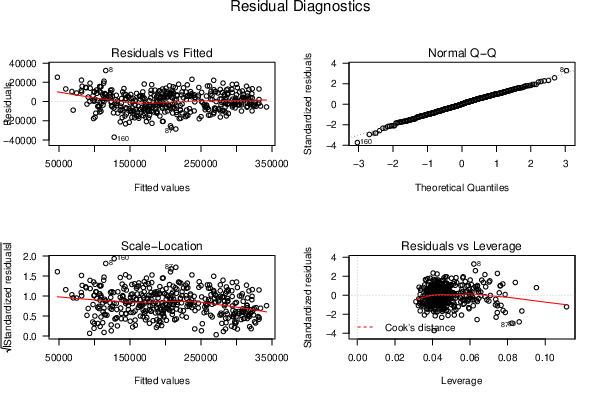
| Menu of Residual Diagnostics | |
| Description | Link |
| Histogram | Compute |
| Central Tendency | Compute |
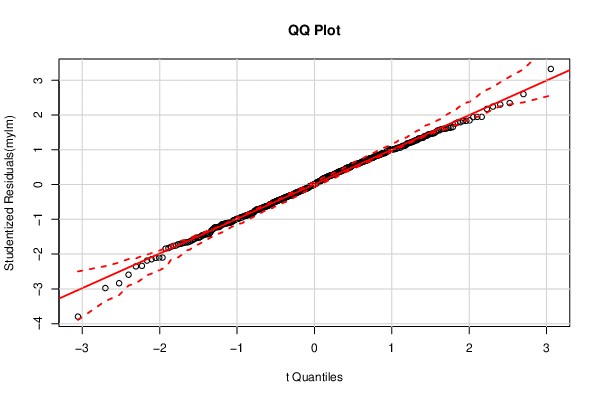
| QQ Plot | Compute |
| Kernel Density Plot | Compute |
| Skewness/Kurtosis Test | Compute |
| Skewness-Kurtosis Plot | Compute |
| Harrell-Davis Plot | Compute |
| Bootstrap Plot -- Central Tendency | Compute |
| Blocked Bootstrap Plot -- Central Tendency | Compute |
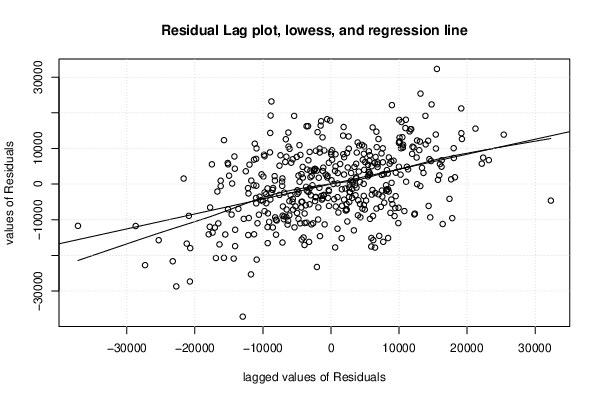
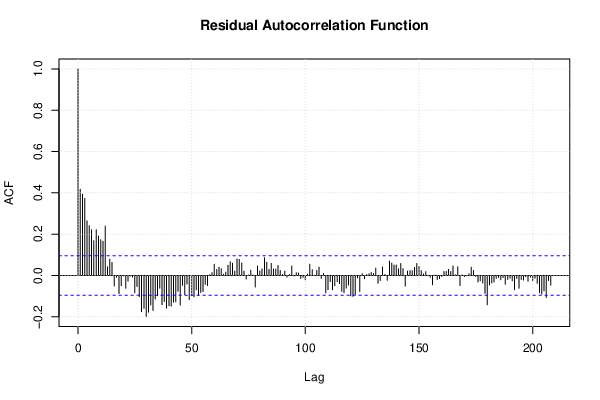
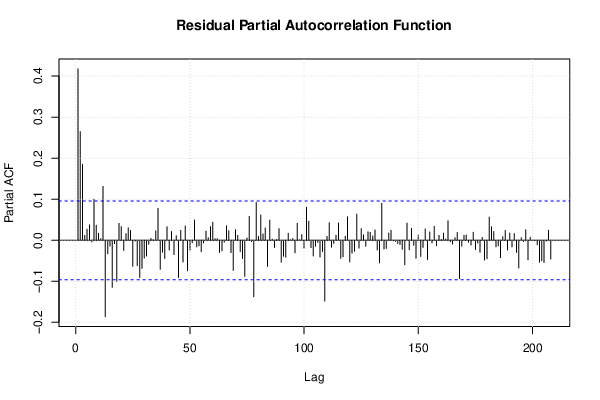
| (Partial) Autocorrelation Plot | Compute |
| Spectral Analysis | Compute |
| Tukey lambda PPCC Plot | Compute |
| Box-Cox Normality Plot | Compute |
| Summary Statistics | Compute |
| Ramsey RESET F-Test for powers (2 and 3) of fitted values |
> reset_test_fitted RESET test data: mylm RESET = 43.054, df1 = 2, df2 = 395, p-value < 2.2e-16 |
| Ramsey RESET F-Test for powers (2 and 3) of regressors |
> reset_test_regressors RESET test data: mylm RESET = 9.3478, df1 = 38, df2 = 359, p-value < 2.2e-16 |
| Ramsey RESET F-Test for powers (2 and 3) of principal components |
> reset_test_principal_components RESET test data: mylm RESET = 13.801, df1 = 2, df2 = 395, p-value = 1.608e-06 |
| Variance Inflation Factors (Multicollinearity) |
> vif
              unit_price                      cpi                defl_tval
               22.373639               758.881515                20.686821
             US_IND_PROD `barrels_purchased(t-1)` `barrels_purchased(t-2)`
               50.127023                18.969680                19.339799
`barrels_purchased(t-3)`                       M1                       M2
               17.778887                 2.251404                 2.214003
                      M3                       M4                       M5
                2.123989                 2.083930                 2.083141
                      M6                       M7                       M8
                2.166092                 1.958271                 2.110525
                      M9                      M10                      M11
                1.944192                 1.957333                 2.111429
                       t
             1031.312781
|