Free Statistics

of Irreproducible Research!

Author's title

Author*The author of this computation has been verified*
R Software Modulerwasp_decompose.wasp
Title produced by softwareClassical Decomposition
Date of computationWed, 12 Dec 2018 18:34:59 +0100
Cite this page as followsStatistical Computations at FreeStatistics.org, Office for Research Development and Education, URL https://freestatistics.org/blog/index.php?v=date/2018/Dec/12/t1544636401g1gfvr0yni7aga8.htm/, Retrieved Mon, 06 May 2024 17:05:34 +0000
Statistical Computations at FreeStatistics.org, Office for Research Development and Education, URL https://freestatistics.org/blog/index.php?pk=315865, Retrieved Mon, 06 May 2024 17:05:34 +0000
QR Codes:

Original text written by user:
IsPrivate?No (this computation is public)
User-defined keywords
Estimated Impact117
Family? (F = Feedback message, R = changed R code, M = changed R Module, P = changed Parameters, D = changed Data)
-       [Classical Decomposition] [Seizonaliteit] [2018-12-12 17:34:59] [18ddfe38bfc2d98b48759e4537eb3733] [Current]
Feedback Forum

Post a new message
Dataseries X:
0.386
0.374
0.393
0.425
0.406
0.344
0.327
0.288
0.269
0.256
0.286
0.298
0.329
0.318
0.381
0.381
0.47
0.443
0.386
0.342
0.319
0.307
0.284
0.326
0.309
0.359
0.376
0.416
0.437
0.548


Summary of computational transaction
Raw Input view raw input (R code)
Raw Outputview raw output of R engine
Computing time2 seconds
R ServerBig Analytics Cloud Computing Center

\begin{tabular}{lllllllll}
\hline
Summary of computational transaction \tabularnewline
Raw Input view raw input (R code)  \tabularnewline
Raw Outputview raw output of R engine  \tabularnewline
Computing time2 seconds \tabularnewline
R ServerBig Analytics Cloud Computing Center \tabularnewline
\hline
\end{tabular}
%Source: https://freestatistics.org/blog/index.php?pk=315865&T=0

[TABLE]
[ROW]
Summary of computational transaction[/C][/ROW] [ROW]Raw Input[/C] view raw input (R code) [/C][/ROW] [ROW]Raw Output[/C]view raw output of R engine [/C][/ROW] [ROW]Computing time[/C]2 seconds[/C][/ROW] [ROW]R Server[/C]Big Analytics Cloud Computing Center[/C][/ROW] [/TABLE] Source: https://freestatistics.org/blog/index.php?pk=315865&T=0

Globally Unique Identifier (entire table): ba.freestatistics.org/blog/index.php?pk=315865&T=0

As an alternative you can also use a QR Code:  

The GUIDs for individual cells are displayed in the table below:

Summary of computational transaction
Raw Input view raw input (R code)
Raw Outputview raw output of R engine
Computing time2 seconds
R ServerBig Analytics Cloud Computing Center


Classical Decomposition by Moving Averages
tObservationsFitTrendSeasonalRandom
10.386NANA0.00764435NA
20.374NANA-0.00431399NA
30.3930.3942720.397-0.00272768-0.00127232
40.4250.3951470.39575-0.0006026790.0298527
50.4060.3913940.383750.007644350.0146057
60.3440.3540610.358375-0.00431399-0.010061
70.3270.3213970.324125-0.002727680.00560268
80.2880.2953970.296-0.000602679-0.00739732
90.2690.2875190.2798750.00764435-0.0185193
100.2560.2716860.276-0.00431399-0.015686
110.2860.2820220.28475-0.002727680.00397768
120.2980.2993970.3-0.000602679-0.00139732
130.3290.3272690.3196250.007644350.00173065
140.3180.3375610.341875-0.00431399-0.019561
150.3810.3671470.369875-0.002727680.0138527
160.3810.4025220.403125-0.000602679-0.0215223
170.470.4270190.4193750.007644350.0429807
180.4430.4108110.415125-0.004313990.032189
190.3860.3886470.391375-0.00272768-0.00264732
200.3420.3548970.3555-0.000602679-0.0128973
210.3190.3333940.325750.00764435-0.0143943
220.3070.3066860.311-0.004313990.000313988
230.2840.3050220.30775-0.00272768-0.0210223
240.3260.3123970.313-0.0006026790.0136027
250.3090.3386440.3310.00764435-0.0296443
260.3590.3494360.35375-0.004313990.00956399
270.3760.3782720.381-0.00272768-0.00227232
280.4160.4200220.420625-0.000602679-0.00402232
290.437NANA0.00764435NA
300.548NANA-0.00431399NA

\begin{tabular}{lllllllll}
\hline
Classical Decomposition by Moving Averages \tabularnewline
t & Observations & Fit & Trend & Seasonal & Random \tabularnewline
1 & 0.386 & NA & NA & 0.00764435 & NA \tabularnewline
2 & 0.374 & NA & NA & -0.00431399 & NA \tabularnewline
3 & 0.393 & 0.394272 & 0.397 & -0.00272768 & -0.00127232 \tabularnewline
4 & 0.425 & 0.395147 & 0.39575 & -0.000602679 & 0.0298527 \tabularnewline
5 & 0.406 & 0.391394 & 0.38375 & 0.00764435 & 0.0146057 \tabularnewline
6 & 0.344 & 0.354061 & 0.358375 & -0.00431399 & -0.010061 \tabularnewline
7 & 0.327 & 0.321397 & 0.324125 & -0.00272768 & 0.00560268 \tabularnewline
8 & 0.288 & 0.295397 & 0.296 & -0.000602679 & -0.00739732 \tabularnewline
9 & 0.269 & 0.287519 & 0.279875 & 0.00764435 & -0.0185193 \tabularnewline
10 & 0.256 & 0.271686 & 0.276 & -0.00431399 & -0.015686 \tabularnewline
11 & 0.286 & 0.282022 & 0.28475 & -0.00272768 & 0.00397768 \tabularnewline
12 & 0.298 & 0.299397 & 0.3 & -0.000602679 & -0.00139732 \tabularnewline
13 & 0.329 & 0.327269 & 0.319625 & 0.00764435 & 0.00173065 \tabularnewline
14 & 0.318 & 0.337561 & 0.341875 & -0.00431399 & -0.019561 \tabularnewline
15 & 0.381 & 0.367147 & 0.369875 & -0.00272768 & 0.0138527 \tabularnewline
16 & 0.381 & 0.402522 & 0.403125 & -0.000602679 & -0.0215223 \tabularnewline
17 & 0.47 & 0.427019 & 0.419375 & 0.00764435 & 0.0429807 \tabularnewline
18 & 0.443 & 0.410811 & 0.415125 & -0.00431399 & 0.032189 \tabularnewline
19 & 0.386 & 0.388647 & 0.391375 & -0.00272768 & -0.00264732 \tabularnewline
20 & 0.342 & 0.354897 & 0.3555 & -0.000602679 & -0.0128973 \tabularnewline
21 & 0.319 & 0.333394 & 0.32575 & 0.00764435 & -0.0143943 \tabularnewline
22 & 0.307 & 0.306686 & 0.311 & -0.00431399 & 0.000313988 \tabularnewline
23 & 0.284 & 0.305022 & 0.30775 & -0.00272768 & -0.0210223 \tabularnewline
24 & 0.326 & 0.312397 & 0.313 & -0.000602679 & 0.0136027 \tabularnewline
25 & 0.309 & 0.338644 & 0.331 & 0.00764435 & -0.0296443 \tabularnewline
26 & 0.359 & 0.349436 & 0.35375 & -0.00431399 & 0.00956399 \tabularnewline
27 & 0.376 & 0.378272 & 0.381 & -0.00272768 & -0.00227232 \tabularnewline
28 & 0.416 & 0.420022 & 0.420625 & -0.000602679 & -0.00402232 \tabularnewline
29 & 0.437 & NA & NA & 0.00764435 & NA \tabularnewline
30 & 0.548 & NA & NA & -0.00431399 & NA \tabularnewline
\hline
\end{tabular}
%Source: https://freestatistics.org/blog/index.php?pk=315865&T=1

[TABLE]
[ROW][C]Classical Decomposition by Moving Averages[/C][/ROW]
[ROW][C]t[/C][C]Observations[/C][C]Fit[/C][C]Trend[/C][C]Seasonal[/C][C]Random[/C][/ROW]
[ROW][C]1[/C][C]0.386[/C][C]NA[/C][C]NA[/C][C]0.00764435[/C][C]NA[/C][/ROW]
[ROW][C]2[/C][C]0.374[/C][C]NA[/C][C]NA[/C][C]-0.00431399[/C][C]NA[/C][/ROW]
[ROW][C]3[/C][C]0.393[/C][C]0.394272[/C][C]0.397[/C][C]-0.00272768[/C][C]-0.00127232[/C][/ROW]
[ROW][C]4[/C][C]0.425[/C][C]0.395147[/C][C]0.39575[/C][C]-0.000602679[/C][C]0.0298527[/C][/ROW]
[ROW][C]5[/C][C]0.406[/C][C]0.391394[/C][C]0.38375[/C][C]0.00764435[/C][C]0.0146057[/C][/ROW]
[ROW][C]6[/C][C]0.344[/C][C]0.354061[/C][C]0.358375[/C][C]-0.00431399[/C][C]-0.010061[/C][/ROW]
[ROW][C]7[/C][C]0.327[/C][C]0.321397[/C][C]0.324125[/C][C]-0.00272768[/C][C]0.00560268[/C][/ROW]
[ROW][C]8[/C][C]0.288[/C][C]0.295397[/C][C]0.296[/C][C]-0.000602679[/C][C]-0.00739732[/C][/ROW]
[ROW][C]9[/C][C]0.269[/C][C]0.287519[/C][C]0.279875[/C][C]0.00764435[/C][C]-0.0185193[/C][/ROW]
[ROW][C]10[/C][C]0.256[/C][C]0.271686[/C][C]0.276[/C][C]-0.00431399[/C][C]-0.015686[/C][/ROW]
[ROW][C]11[/C][C]0.286[/C][C]0.282022[/C][C]0.28475[/C][C]-0.00272768[/C][C]0.00397768[/C][/ROW]
[ROW][C]12[/C][C]0.298[/C][C]0.299397[/C][C]0.3[/C][C]-0.000602679[/C][C]-0.00139732[/C][/ROW]
[ROW][C]13[/C][C]0.329[/C][C]0.327269[/C][C]0.319625[/C][C]0.00764435[/C][C]0.00173065[/C][/ROW]
[ROW][C]14[/C][C]0.318[/C][C]0.337561[/C][C]0.341875[/C][C]-0.00431399[/C][C]-0.019561[/C][/ROW]
[ROW][C]15[/C][C]0.381[/C][C]0.367147[/C][C]0.369875[/C][C]-0.00272768[/C][C]0.0138527[/C][/ROW]
[ROW][C]16[/C][C]0.381[/C][C]0.402522[/C][C]0.403125[/C][C]-0.000602679[/C][C]-0.0215223[/C][/ROW]
[ROW][C]17[/C][C]0.47[/C][C]0.427019[/C][C]0.419375[/C][C]0.00764435[/C][C]0.0429807[/C][/ROW]
[ROW][C]18[/C][C]0.443[/C][C]0.410811[/C][C]0.415125[/C][C]-0.00431399[/C][C]0.032189[/C][/ROW]
[ROW][C]19[/C][C]0.386[/C][C]0.388647[/C][C]0.391375[/C][C]-0.00272768[/C][C]-0.00264732[/C][/ROW]
[ROW][C]20[/C][C]0.342[/C][C]0.354897[/C][C]0.3555[/C][C]-0.000602679[/C][C]-0.0128973[/C][/ROW]
[ROW][C]21[/C][C]0.319[/C][C]0.333394[/C][C]0.32575[/C][C]0.00764435[/C][C]-0.0143943[/C][/ROW]
[ROW][C]22[/C][C]0.307[/C][C]0.306686[/C][C]0.311[/C][C]-0.00431399[/C][C]0.000313988[/C][/ROW]
[ROW][C]23[/C][C]0.284[/C][C]0.305022[/C][C]0.30775[/C][C]-0.00272768[/C][C]-0.0210223[/C][/ROW]
[ROW][C]24[/C][C]0.326[/C][C]0.312397[/C][C]0.313[/C][C]-0.000602679[/C][C]0.0136027[/C][/ROW]
[ROW][C]25[/C][C]0.309[/C][C]0.338644[/C][C]0.331[/C][C]0.00764435[/C][C]-0.0296443[/C][/ROW]
[ROW][C]26[/C][C]0.359[/C][C]0.349436[/C][C]0.35375[/C][C]-0.00431399[/C][C]0.00956399[/C][/ROW]
[ROW][C]27[/C][C]0.376[/C][C]0.378272[/C][C]0.381[/C][C]-0.00272768[/C][C]-0.00227232[/C][/ROW]
[ROW][C]28[/C][C]0.416[/C][C]0.420022[/C][C]0.420625[/C][C]-0.000602679[/C][C]-0.00402232[/C][/ROW]
[ROW][C]29[/C][C]0.437[/C][C]NA[/C][C]NA[/C][C]0.00764435[/C][C]NA[/C][/ROW]
[ROW][C]30[/C][C]0.548[/C][C]NA[/C][C]NA[/C][C]-0.00431399[/C][C]NA[/C][/ROW]
[/TABLE]
Source: https://freestatistics.org/blog/index.php?pk=315865&T=1

Globally Unique Identifier (entire table): ba.freestatistics.org/blog/index.php?pk=315865&T=1

As an alternative you can also use a QR Code:  

The GUIDs for individual cells are displayed in the table below:

Classical Decomposition by Moving Averages
tObservationsFitTrendSeasonalRandom
10.386NANA0.00764435NA
20.374NANA-0.00431399NA
30.3930.3942720.397-0.00272768-0.00127232
40.4250.3951470.39575-0.0006026790.0298527
50.4060.3913940.383750.007644350.0146057
60.3440.3540610.358375-0.00431399-0.010061
70.3270.3213970.324125-0.002727680.00560268
80.2880.2953970.296-0.000602679-0.00739732
90.2690.2875190.2798750.00764435-0.0185193
100.2560.2716860.276-0.00431399-0.015686
110.2860.2820220.28475-0.002727680.00397768
120.2980.2993970.3-0.000602679-0.00139732
130.3290.3272690.3196250.007644350.00173065
140.3180.3375610.341875-0.00431399-0.019561
150.3810.3671470.369875-0.002727680.0138527
160.3810.4025220.403125-0.000602679-0.0215223
170.470.4270190.4193750.007644350.0429807
180.4430.4108110.415125-0.004313990.032189
190.3860.3886470.391375-0.00272768-0.00264732
200.3420.3548970.3555-0.000602679-0.0128973
210.3190.3333940.325750.00764435-0.0143943
220.3070.3066860.311-0.004313990.000313988
230.2840.3050220.30775-0.00272768-0.0210223
240.3260.3123970.313-0.0006026790.0136027
250.3090.3386440.3310.00764435-0.0296443
260.3590.3494360.35375-0.004313990.00956399
270.3760.3782720.381-0.00272768-0.00227232
280.4160.4200220.420625-0.000602679-0.00402232
290.437NANA0.00764435NA
300.548NANA-0.00431399NA


Parameters (Session):
Parameters (R input):
par1 = additive ; par2 = 4 ;
R code (references can be found in the software module):
par2 <- as.numeric(par2)
x <- ts(x,freq=par2)
m <- decompose(x,type=par1)
m$figure
bitmap(file='test1.png')
plot(m)
dev.off()
mylagmax <- length(x)/2
bitmap(file='test2.png')
op <- par(mfrow = c(2,2))
acf(as.numeric(x),lag.max = mylagmax,main='Observed')
acf(as.numeric(m$trend),na.action=na.pass,lag.max = mylagmax,main='Trend')
acf(as.numeric(m$seasonal),na.action=na.pass,lag.max = mylagmax,main='Seasonal')
acf(as.numeric(m$random),na.action=na.pass,lag.max = mylagmax,main='Random')
par(op)
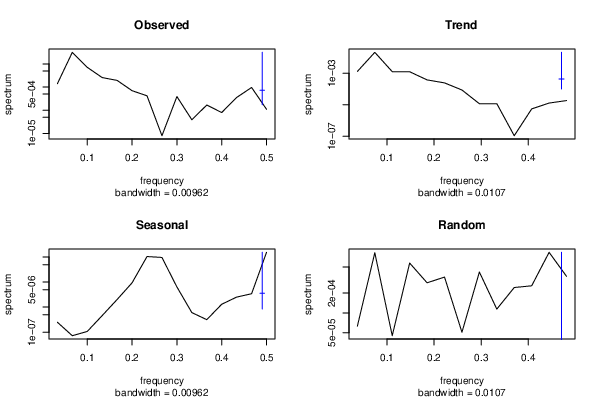
dev.off()
bitmap(file='test3.png')
op <- par(mfrow = c(2,2))
spectrum(as.numeric(x),main='Observed')
spectrum(as.numeric(m$trend[!is.na(m$trend)]),main='Trend')
spectrum(as.numeric(m$seasonal[!is.na(m$seasonal)]),main='Seasonal')
spectrum(as.numeric(m$random[!is.na(m$random)]),main='Random')
par(op)
dev.off()
bitmap(file='test4.png')
op <- par(mfrow = c(2,2))
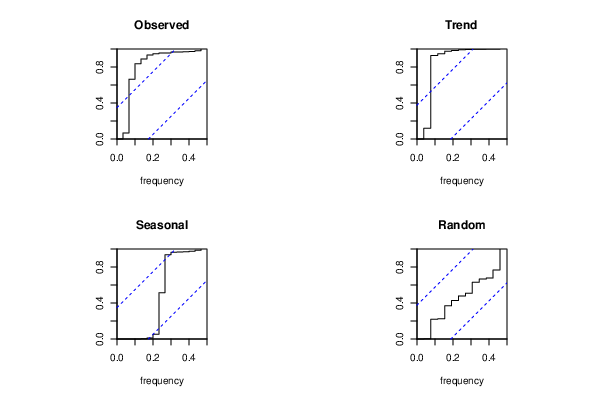
cpgram(as.numeric(x),main='Observed')
cpgram(as.numeric(m$trend[!is.na(m$trend)]),main='Trend')
cpgram(as.numeric(m$seasonal[!is.na(m$seasonal)]),main='Seasonal')
cpgram(as.numeric(m$random[!is.na(m$random)]),main='Random')
par(op)
dev.off()
load(file='createtable')
a<-table.start()
a<-table.row.start(a)
a<-table.element(a,'Classical Decomposition by Moving Averages',6,TRUE)
a<-table.row.end(a)
a<-table.row.start(a)
a<-table.element(a,'t',header=TRUE)
a<-table.element(a,'Observations',header=TRUE)
a<-table.element(a,'Fit',header=TRUE)
a<-table.element(a,'Trend',header=TRUE)
a<-table.element(a,'Seasonal',header=TRUE)
a<-table.element(a,'Random',header=TRUE)
a<-table.row.end(a)
for (i in 1:length(m$trend)) {
a<-table.row.start(a)
a<-table.element(a,i,header=TRUE)
a<-table.element(a,x[i])
if (par1 == 'additive') a<-table.element(a,signif(m$trend[i]+m$seasonal[i],6)) else a<-table.element(a,signif(m$trend[i]*m$seasonal[i],6))
a<-table.element(a,signif(m$trend[i],6))
a<-table.element(a,signif(m$seasonal[i],6))
a<-table.element(a,signif(m$random[i],6))
a<-table.row.end(a)
}
a<-table.end(a)
table.save(a,file='mytable.tab')