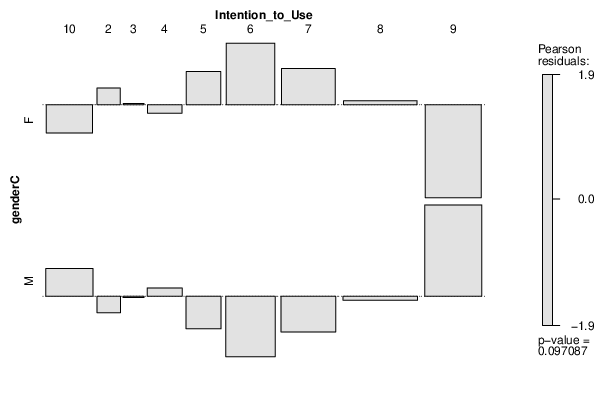
| Tabulation of Results | |||||||||
| genderC x Intention_to_Use | |||||||||
| 10 | 2 | 3 | 4 | 5 | 6 | 7 | 8 | 9 | F | 8 | 3 | 2 | 5 | 7 | 15 | 16 | 25 | 7 | M | 12 | 2 | 2 | 6 | 4 | 7 | 11 | 25 | 22 |
| Tabulation of Expected Results | |||||||||
| genderC x Intention_to_Use | |||||||||
| 10 | 2 | 3 | 4 | 5 | 6 | 7 | 8 | 9 | F | 9.83 | 2.46 | 1.97 | 5.41 | 5.41 | 10.82 | 13.27 | 24.58 | 14.26 | M | 10.17 | 2.54 | 2.03 | 5.59 | 5.59 | 11.18 | 13.73 | 25.42 | 14.74 |
| Statistical Results | |
| Pearson's Chi-squared test | |
| Pearson Chi Square Statistic | 13.46 |
| Degrees of Freedom | 8 |
| P value | 0.1 |