| Multiple Linear Regression - Estimated Regression Equation |
| barrels_purchased[t] = + 75150 -1307.99cpi[t] -52.1466unit_price[t] + 145.537US_IND_PROD[t] + 0.322095`barrels_purchased(t-1)`[t] + 0.278952`barrels_purchased(t-2)`[t] + 0.235297`barrels_purchased(t-3)`[t] + 5950.23M1[t] + 11752.8M2[t] + 6724.72M3[t] + 5415.77M4[t] + 6896.75M5[t] -8440.23M6[t] -2351.05M7[t] -11217.9M8[t] -8735.48M9[t] + 1040.14M10[t] -23997.9M11[t] + 569.901t + e[t] |
| Multiple Linear Regression - Ordinary Least Squares | |||||
| Variable | Parameter | S.D. | T-STAT H0: parameter = 0 | 2-tail p-value | 1-tail p-value |
| (Intercept) | +7.515e+04 | 3.059e+04 | +2.4560e+00 | 0.01446 | 0.00723 |
| cpi | -1308 | 469.3 | -2.7870e+00 | 0.00557 | 0.002785 |
| unit_price | -52.15 | 85.8 | -6.0780e-01 | 0.5437 | 0.2718 |
| US_IND_PROD | +145.5 | 300.9 | +4.8360e-01 | 0.6289 | 0.3145 |
| `barrels_purchased(t-1)` | +0.3221 | 0.04879 | +6.6020e+00 | 1.299e-10 | 6.494e-11 |
| `barrels_purchased(t-2)` | +0.2789 | 0.04924 | +5.6650e+00 | 2.83e-08 | 1.415e-08 |
| `barrels_purchased(t-3)` | +0.2353 | 0.04807 | +4.8950e+00 | 1.433e-06 | 7.164e-07 |
| M1 | +5950 | 4457 | +1.3350e+00 | 0.1826 | 0.09131 |
| M2 | +1.175e+04 | 4418 | +2.6600e+00 | 0.008127 | 0.004063 |
| M3 | +6725 | 4335 | +1.5510e+00 | 0.1216 | 0.0608 |
| M4 | +5416 | 4296 | +1.2610e+00 | 0.2081 | 0.1041 |
| M5 | +6897 | 4295 | +1.6060e+00 | 0.1091 | 0.05456 |
| M6 | -8440 | 4347 | -1.9420e+00 | 0.05289 | 0.02644 |
| M7 | -2351 | 4156 | -5.6580e-01 | 0.5719 | 0.2859 |
| M8 | -1.122e+04 | 4287 | -2.6170e+00 | 0.009212 | 0.004606 |
| M9 | -8736 | 4132 | -2.1140e+00 | 0.03512 | 0.01756 |
| M10 | +1040 | 4219 | +2.4650e-01 | 0.8054 | 0.4027 |
| M11 | -2.4e+04 | 4323 | -5.5510e+00 | 5.2e-08 | 2.6e-08 |
| t | +569.9 | 218.1 | +2.6130e+00 | 0.009305 | 0.004653 |
| Multiple Linear Regression - Regression Statistics | |
| Multiple R | 0.9726 |
| R-squared | 0.9459 |
| Adjusted R-squared | 0.9435 |
| F-TEST (value) | 386.7 |
| F-TEST (DF numerator) | 18 |
| F-TEST (DF denominator) | 398 |
| p-value | 0 |
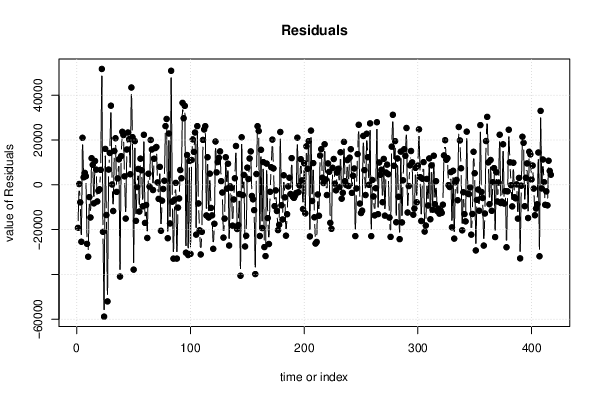
| Multiple Linear Regression - Residual Statistics | |
| Residual Standard Deviation | 1.685e+04 |
| Sum Squared Residuals | 1.13e+11 |
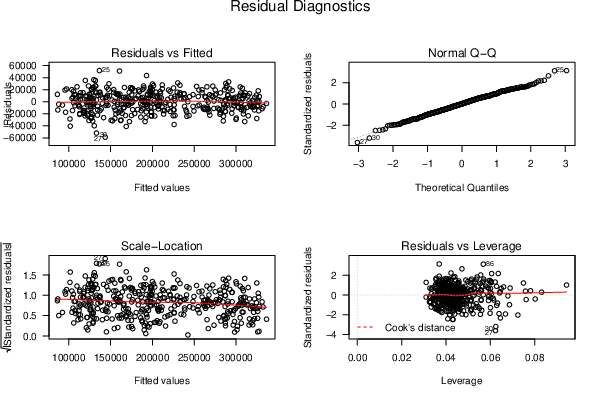
| Menu of Residual Diagnostics | |
| Description | Link |
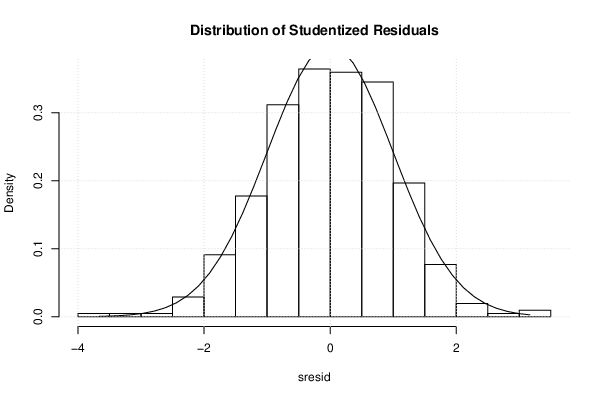
| Histogram | Compute |
| Central Tendency | Compute |
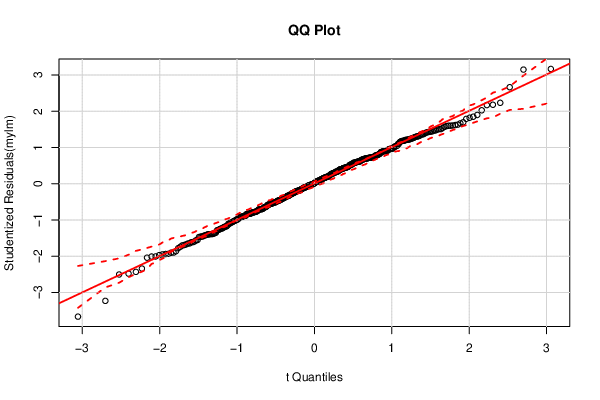
| QQ Plot | Compute |
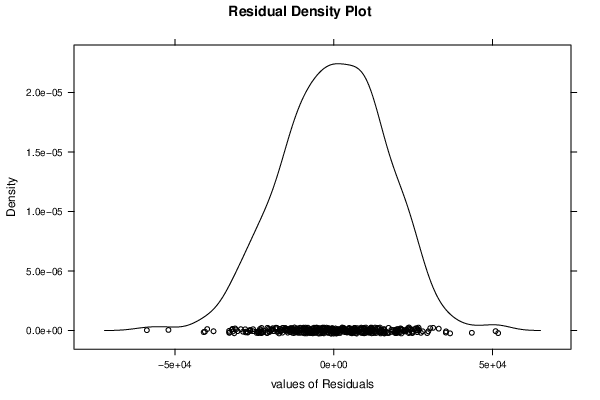
| Kernel Density Plot | Compute |
| Skewness/Kurtosis Test | Compute |
| Skewness-Kurtosis Plot | Compute |
| Harrell-Davis Plot | Compute |
| Bootstrap Plot -- Central Tendency | Compute |
| Blocked Bootstrap Plot -- Central Tendency | Compute |
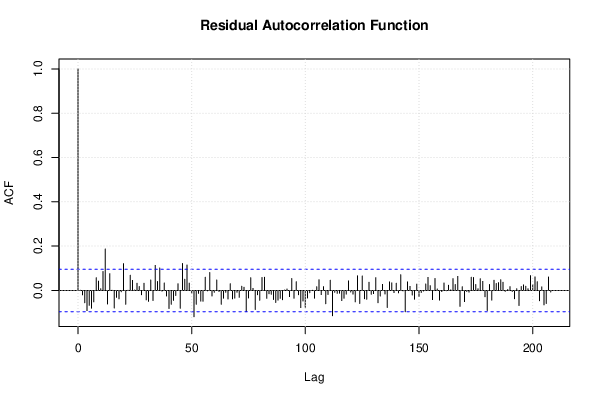
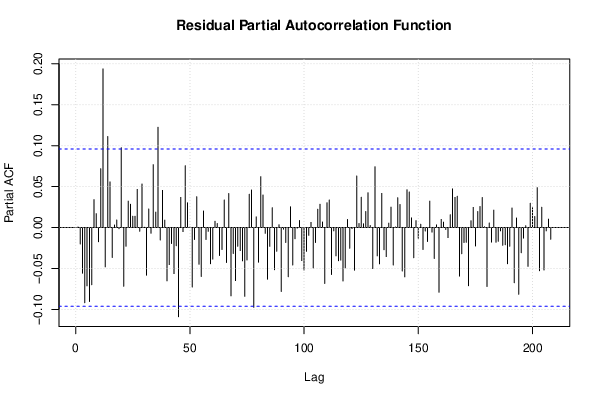
| (Partial) Autocorrelation Plot | Compute |
| Spectral Analysis | Compute |
| Tukey lambda PPCC Plot | Compute |
| Box-Cox Normality Plot | Compute |
| Summary Statistics | Compute |
| Ramsey RESET F-Test for powers (2 and 3) of fitted values |
> reset_test_fitted RESET test data: mylm RESET = 2.2267, df1 = 2, df2 = 396, p-value = 0.1092 |
| Ramsey RESET F-Test for powers (2 and 3) of regressors |
> reset_test_regressors RESET test data: mylm RESET = 0.99915, df1 = 36, df2 = 362, p-value = 0.4744 |
| Ramsey RESET F-Test for powers (2 and 3) of principal components |
> reset_test_principal_components RESET test data: mylm RESET = 7.7095, df1 = 2, df2 = 396, p-value = 0.0005192 |
| Variance Inflation Factors (Multicollinearity) |
> vif
                     cpi               unit_price              US_IND_PROD
              713.791625                 1.865501                48.707837
`barrels_purchased(t-1)` `barrels_purchased(t-2)` `barrels_purchased(t-3)`
               17.512974                17.866306                17.009943
                      M1                       M2                       M3
                2.242697                 2.203886                 2.121380
                      M4                       M5                       M6
                2.083521                 2.082724                 2.133470
                      M7                       M8                       M9
                1.949679                 2.074807                 1.927435
                     M10                      M11                        t
                1.957260                 2.055328              1011.902399
|