Free Statistics

of Irreproducible Research!

Author's title

Author*The author of this computation has been verified*
R Software Modulerwasp_qqplot.wasp
Title produced by softwareQQPlot and Histogram
Date of computationTue, 04 Dec 2018 17:56:52 +0100
Cite this page as followsStatistical Computations at FreeStatistics.org, Office for Research Development and Education, URL https://freestatistics.org/blog/index.php?v=date/2018/Dec/04/t1543942709xf4dealjxo55qkg.htm/, Retrieved Wed, 08 May 2024 19:16:40 +0000
Statistical Computations at FreeStatistics.org, Office for Research Development and Education, URL https://freestatistics.org/blog/index.php?pk=315760, Retrieved Wed, 08 May 2024 19:16:40 +0000
QR Codes:

Original text written by user:
IsPrivate?No (this computation is public)
User-defined keywordsQQ Plot -> lijken niet op elkaar = geen correlatie
Estimated Impact87
Family? (F = Feedback message, R = changed R code, M = changed R Module, P = changed Parameters, D = changed Data)
-       [QQPlot and Histogram] [QQ plots bouwverg...] [2018-12-04 16:56:52] [47345ce27c85849acb4e002f9fcbccb4] [Current]
Feedback Forum

Post a new message
Dataseries X:
2570
2669
2450
2842
3440
2678
2981
2260
2844
2546
2456
2295
2379
2471
2057
2280
2351
2276
2548
2311
2201
2725
2408
2139
1898
2539
2070
2063
2565
2443
2196
2799
2076
2628
2292
2155
2476
2138
1854
2081
1795
1756
2237
1960
1829
2524
2077
2366
2185
2098
1836
1863
2044
2136
2931
3263
3328
3570
2313
1623
1316
1507
1419
1660
1790
1733
2086
1814
2241
1943
1773
2143
2087
1805
1913
2296
2500
2210
2526
2249
2024
2091
2045
1882
1831
1964
1763
1688
2149
1823
2094
2145
1791
1996
2097
1796
1963
2042
1746
2210
2968
3126
3708
3015
1569
1518
1393
1615
1777
1648
1463
1779
Dataseries Y:
5331
3075
2002
2306
1507
1992
2487
3490
4647
5594
5611
5788
6204
3013
1931
2549
1504
2090
2702
2939
4500
6208
6415
5657
5964
3163
1997
2422
1376
2202
2683
3303
5202
5231
4880
7998
4977
3531
2025
2205
1442
2238
2179
3218
5139
4990
4914
6084
5672
3548
1793
2086
1262
1743
1964
3258
4966
4944
5907
5561
5321
3582
1757
1894
1192
1658
1919
3354
4529
5233
5910
5164
5152
3057
1855
1978
1255
1693
2449
3178
4831
6025
4492
5174
5600
2752
1925
2824
1041
1476
2239
2727
4303
5160
4103
5554
4906
2677
1677
1991
993
1800
2012
2880
4705
5107
4482
5966
4858
3036
1844
2196


Summary of computational transaction
Raw Input view raw input (R code)
Raw Outputview raw output of R engine
Computing time7 seconds
R ServerBig Analytics Cloud Computing Center

\begin{tabular}{lllllllll}
\hline
Summary of computational transaction \tabularnewline
Raw Input view raw input (R code)  \tabularnewline
Raw Outputview raw output of R engine  \tabularnewline
Computing time7 seconds \tabularnewline
R ServerBig Analytics Cloud Computing Center \tabularnewline
\hline
\end{tabular}
%Source: https://freestatistics.org/blog/index.php?pk=315760&T=0

[TABLE]
[ROW]
Summary of computational transaction[/C][/ROW] [ROW]Raw Input[/C] view raw input (R code) [/C][/ROW] [ROW]Raw Output[/C]view raw output of R engine [/C][/ROW] [ROW]Computing time[/C]7 seconds[/C][/ROW] [ROW]R Server[/C]Big Analytics Cloud Computing Center[/C][/ROW] [/TABLE] Source: https://freestatistics.org/blog/index.php?pk=315760&T=0

Globally Unique Identifier (entire table): ba.freestatistics.org/blog/index.php?pk=315760&T=0

As an alternative you can also use a QR Code:  

The GUIDs for individual cells are displayed in the table below:

Summary of computational transaction
Raw Input view raw input (R code)
Raw Outputview raw output of R engine
Computing time7 seconds
R ServerBig Analytics Cloud Computing Center


Descriptive Statistics
mean of X2195.66071428571
standard deviation of X468.013427727046
mean of Y3527.63392857143
standard deviation of Y1653.22552319706

\begin{tabular}{lllllllll}
\hline
Descriptive Statistics \tabularnewline
mean of X & 2195.66071428571 \tabularnewline
standard deviation of X & 468.013427727046 \tabularnewline
mean of Y & 3527.63392857143 \tabularnewline
standard deviation of Y & 1653.22552319706 \tabularnewline
\hline
\end{tabular}
%Source: https://freestatistics.org/blog/index.php?pk=315760&T=1

[TABLE]
[ROW][C]Descriptive Statistics[/C][/ROW]
[ROW][C]mean of X[/C][C]2195.66071428571[/C][/ROW]
[ROW][C]standard deviation of X[/C][C]468.013427727046[/C][/ROW]
[ROW][C]mean of Y[/C][C]3527.63392857143[/C][/ROW]
[ROW][C]standard deviation of Y[/C][C]1653.22552319706[/C][/ROW]
[/TABLE]
Source: https://freestatistics.org/blog/index.php?pk=315760&T=1

Globally Unique Identifier (entire table): ba.freestatistics.org/blog/index.php?pk=315760&T=1

As an alternative you can also use a QR Code:  

The GUIDs for individual cells are displayed in the table below:

Descriptive Statistics
mean of X2195.66071428571
standard deviation of X468.013427727046
mean of Y3527.63392857143
standard deviation of Y1653.22552319706


Parameters (Session):
par1 = 0 ;
Parameters (R input):
par1 = 0 ;
R code (references can be found in the software module):
library(car)
if(par1 == '') par1 <- 0
par1 <- as.numeric(par1)
if (par1 < 0) par1 <- 0
bitmap(file='test1.png')
if(par1 > 0) {
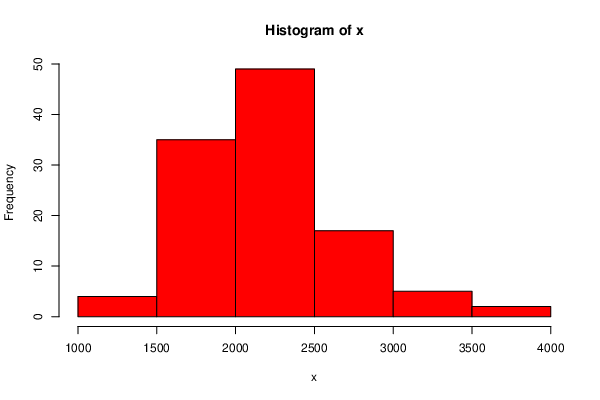
myhist<-hist(x, breaks=par1, col=2,main='Histogram (series X)')
} else {
myhist <- hist(x, col=2)
}
dev.off()
bitmap(file='test1a.png')
if(par1 > 0) {
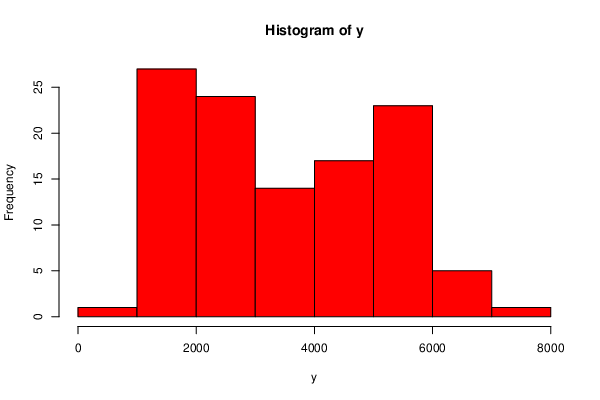
myhist<-hist(y, breaks=par1, col=2,main='Histogram (series Y)')
} else {
myhist <- hist(y, col=2)
}
dev.off()
bitmap(file='test2.png')
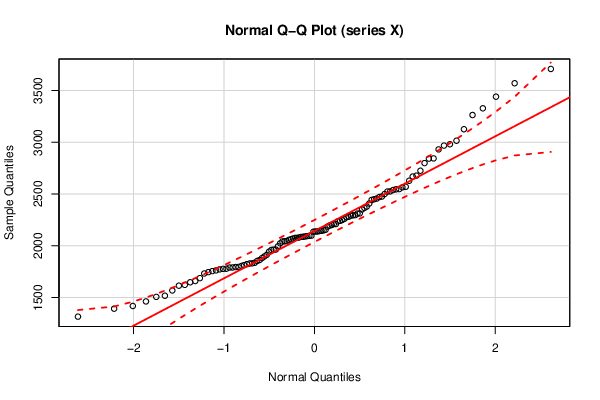
qqPlot(x,main='Normal Q-Q Plot (series X)',ylab='Sample Quantiles',xlab='Normal Quantiles')
dev.off()
bitmap(file='test2a.png')
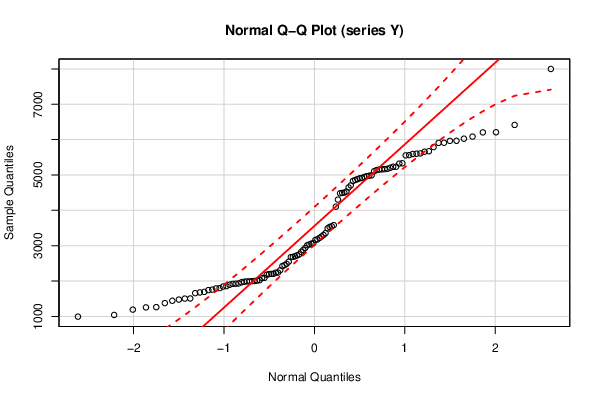
qqPlot(y,main='Normal Q-Q Plot (series Y)',ylab='Sample Quantiles',xlab='Normal Quantiles')
dev.off()
bitmap(file='test3.png')
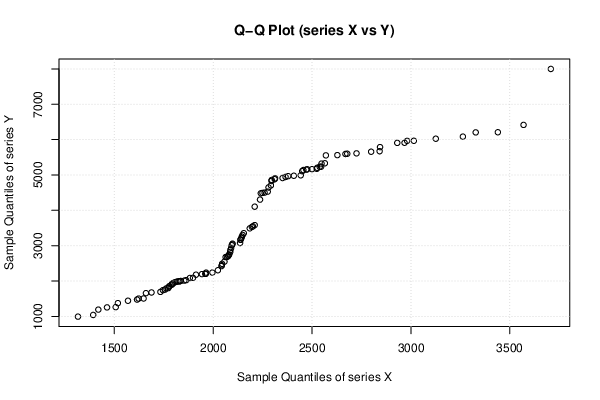
qqplot(x,y,main='Q-Q Plot (series X vs Y)',ylab='Sample Quantiles of series Y',xlab='Sample Quantiles of series X')
qqline(x,y)
grid()
dev.off()
load(file='createtable')
a<-table.start()
a<-table.row.start(a)
a<-table.element(a,'Descriptive Statistics',2,TRUE)
a<-table.row.end(a)
a<-table.row.start(a)
a<-table.element(a,'mean of X',header=TRUE)
a<-table.element(a,mean(x))
a<-table.row.end(a)
a<-table.row.start(a)
a<-table.element(a,'standard deviation of X',header=TRUE)
a<-table.element(a,sd(x))
a<-table.row.end(a)
a<-table.row.start(a)
a<-table.element(a,'mean of Y',header=TRUE)
a<-table.element(a,mean(y))
a<-table.row.end(a)
a<-table.row.start(a)
a<-table.element(a,'standard deviation of Y',header=TRUE)
a<-table.element(a,sd(y))
a<-table.row.end(a)
a<-table.end(a)
table.save(a,file='mytable.tab')