| Pearson Product Moment Correlation - Ungrouped Data | ||
| Statistic | Variable X | Variable Y |
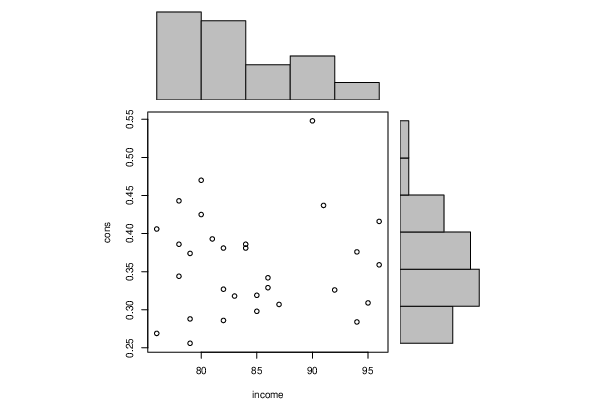
| Mean | 84.6 | 0.359433333333333 |
| Biased Variance | 37.7066666666667 | 0.00418411222222222 |
| Biased Standard Deviation | 6.14057543449038 | 0.0646847139765047 |
| Covariance | 0.0196965517241379 | |
| Correlation | 0.0479353840330963 | |
| Determination | 0.00229780104240042 | |
| T-Test | 0.253942132343237 | |
| p-value (2 sided) | 0.801395816698248 | |
| p-value (1 sided) | 0.400697908349124 | |
| 95% CI of Correlation | [-0.317822520195361, 0.401274734993544] | |
| Degrees of Freedom | 28 | |
| Number of Observations | 30 | |
| Normality Tests |
> jarque.x Jarque-Bera Normality Test data: x JB = 2.4956, p-value = 0.2871 alternative hypothesis: greater |
> jarque.y Jarque-Bera Normality Test data: y JB = 3.0385, p-value = 0.2189 alternative hypothesis: greater |
> ad.x Anderson-Darling normality test data: x A = 0.81204, p-value = 0.03153 |
> ad.y Anderson-Darling normality test data: y A = 0.33422, p-value = 0.4894 |