| Multiple Linear Regression - Estimated Regression Equation |
| [t] = + 827.286 + 0.693429`bouwvergunningen(t-1)`[t] + 0.0547028`bouwvergunningen(t-2)`[t] -0.21035`bouwvergunningen(t-3)`[t] + 394.269M1[t] + 561.79M2[t] + 143.17M3[t] + 630.011M4[t] + 295.46M5[t] + 147.689M6[t] + 561.323M7[t] + 115.461M8[t] + 176.606M9[t] + 286.727M10[t] + 272.342M11[t] -2.11833t + e[t] |
| Multiple Linear Regression - Ordinary Least Squares | |||||
| Variable | Parameter | S.D. | T-STAT H0: parameter = 0 | 2-tail p-value | 1-tail p-value |
| (Intercept) | +827.3 | 242.2 | +3.4160e+00 | 0.0009436 | 0.0004718 |
| `bouwvergunningen(t-1)` | +0.6934 | 0.1013 | +6.8480e+00 | 7.938e-10 | 3.969e-10 |
| `bouwvergunningen(t-2)` | +0.0547 | 0.1241 | +4.4090e-01 | 0.6603 | 0.3301 |
| `bouwvergunningen(t-3)` | -0.2104 | 0.101 | -2.0830e+00 | 0.04004 | 0.02002 |
| M1 | +394.3 | 143.6 | +2.7450e+00 | 0.007266 | 0.003633 |
| M2 | +561.8 | 147.5 | +3.8090e+00 | 0.0002505 | 0.0001253 |
| M3 | +143.2 | 149.1 | +9.6010e-01 | 0.3395 | 0.1698 |
| M4 | +630 | 149.2 | +4.2240e+00 | 5.601e-05 | 2.801e-05 |
| M5 | +295.5 | 153.5 | +1.9250e+00 | 0.05734 | 0.02867 |
| M6 | +147.7 | 152.3 | +9.6960e-01 | 0.3348 | 0.1674 |
| M7 | +561.3 | 151.5 | +3.7050e+00 | 0.0003581 | 0.000179 |
| M8 | +115.5 | 150.4 | +7.6760e-01 | 0.4447 | 0.2223 |
| M9 | +176.6 | 149.5 | +1.1810e+00 | 0.2406 | 0.1203 |
| M10 | +286.7 | 148.8 | +1.9260e+00 | 0.05712 | 0.02856 |
| M11 | +272.3 | 145.3 | +1.8740e+00 | 0.06402 | 0.03201 |
| t | -2.118 | 1.045 | -2.0260e+00 | 0.04559 | 0.0228 |
| Multiple Linear Regression - Regression Statistics | |
| Multiple R | 0.7946 |
| R-squared | 0.6314 |
| Adjusted R-squared | 0.5719 |
| F-TEST (value) | 10.62 |
| F-TEST (DF numerator) | 15 |
| F-TEST (DF denominator) | 93 |
| p-value | 2.331e-14 |
| Multiple Linear Regression - Residual Statistics | |
| Residual Standard Deviation | 307.6 |
| Sum Squared Residuals | 8.8e+06 |
| Menu of Residual Diagnostics | |
| Description | Link |
| Histogram | Compute |
| Central Tendency | Compute |
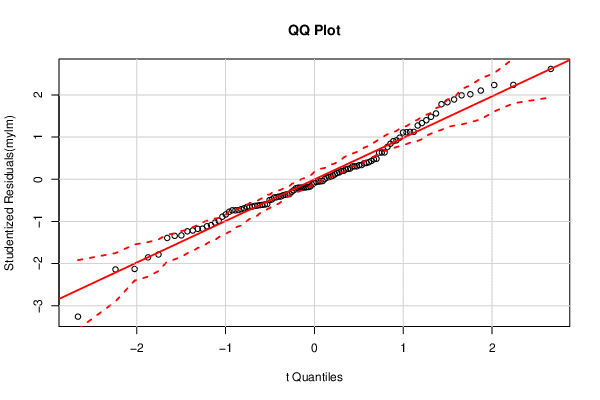
| QQ Plot | Compute |
| Kernel Density Plot | Compute |
| Skewness/Kurtosis Test | Compute |
| Skewness-Kurtosis Plot | Compute |
| Harrell-Davis Plot | Compute |
| Bootstrap Plot -- Central Tendency | Compute |
| Blocked Bootstrap Plot -- Central Tendency | Compute |
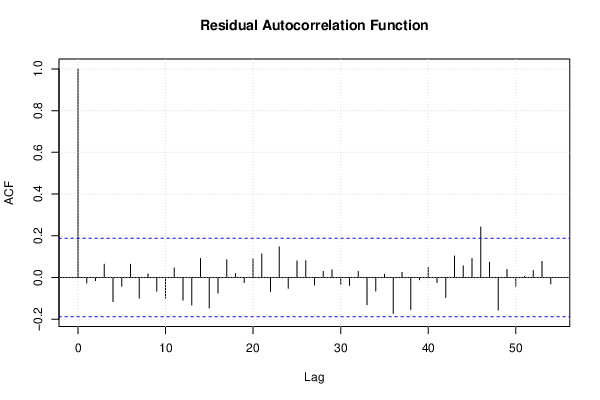
| (Partial) Autocorrelation Plot | Compute |
| Spectral Analysis | Compute |
| Tukey lambda PPCC Plot | Compute |
| Box-Cox Normality Plot | Compute |
| Summary Statistics | Compute |
| Multiple Linear Regression - Actuals, Interpolation, and Residuals | |||
| Time or Index | Actuals | Interpolation Forecast | Residuals Prediction Error |
| 1 | 2842 | 2524 | 318.3 |
| 2 | 3440 | 2928 | 511.8 |
| 3 | 2678 | 2990 | -311.6 |
| 4 | 2981 | 2896 | 84.81 |
| 5 | 2260 | 2602 | -342.2 |
| 6 | 2844 | 2129 | 714.8 |
| 7 | 2546 | 2842 | -296.5 |
| 8 | 2456 | 2371 | 84.55 |
| 9 | 2295 | 2229 | 66.07 |
| 10 | 2379 | 2283 | 95.95 |
| 11 | 2471 | 2335 | 136.1 |
| 12 | 2057 | 2163 | -105.7 |
| 13 | 2280 | 2255 | 24.85 |
| 14 | 2351 | 2533 | -182.2 |
| 15 | 2276 | 2261 | 15.03 |
| 16 | 2548 | 2651 | -102.7 |
| 17 | 2311 | 2484 | -172.6 |
| 18 | 2201 | 2200 | 1.014 |
| 19 | 2725 | 2465 | 260 |
| 20 | 2408 | 2424 | -16.26 |
| 21 | 2139 | 2315 | -176.3 |
| 22 | 1898 | 2109 | -211.2 |
| 23 | 2539 | 1978 | 561.5 |
| 24 | 2070 | 2191 | -121 |
| 25 | 2063 | 2344 | -280.6 |
| 26 | 2565 | 2344 | 221.3 |
| 27 | 2443 | 2369 | 73.67 |
| 28 | 2196 | 2798 | -602.4 |
| 29 | 2799 | 2178 | 620.8 |
| 30 | 2076 | 2459 | -382.6 |
| 31 | 2628 | 2454 | 174.3 |
| 32 | 2292 | 2222 | 69.91 |
| 33 | 2155 | 2230 | -75.4 |
| 34 | 2476 | 2109 | 367.1 |
| 35 | 2138 | 2378 | -240.2 |
| 36 | 1854 | 1916 | -61.72 |
| 37 | 2081 | 2025 | 56.08 |
| 38 | 1795 | 2403 | -608.3 |
| 39 | 1756 | 1856 | -100.4 |
| 40 | 2237 | 2251 | -13.68 |
| 41 | 1960 | 2306 | -345.6 |
| 42 | 1829 | 1998 | -169.1 |
| 43 | 2524 | 2202 | 321.5 |
| 44 | 2077 | 2288 | -210.5 |
| 45 | 2366 | 2102 | 263.8 |
| 46 | 2185 | 2240 | -54.92 |
| 47 | 2098 | 2208 | -109.7 |
| 48 | 1836 | 1802 | 33.74 |
| 49 | 1863 | 2046 | -183 |
| 50 | 2044 | 2234 | -190.1 |
| 51 | 2136 | 1996 | 140.5 |
| 52 | 2931 | 2548 | 382.8 |
| 53 | 3263 | 2730 | 533.2 |
| 54 | 3328 | 2834 | 493.7 |
| 55 | 3570 | 3142 | 428.2 |
| 56 | 2313 | 2795 | -482.3 |
| 57 | 1623 | 1982 | -359.3 |
| 58 | 1316 | 1492 | -176.2 |
| 59 | 1507 | 1489 | 17.56 |
| 60 | 1419 | 1476 | -56.77 |
| 61 | 1660 | 1882 | -221.9 |
| 62 | 1790 | 2169 | -379.5 |
| 63 | 1733 | 1871 | -137.6 |
| 64 | 2086 | 2272 | -186.2 |
| 65 | 1814 | 2150 | -335.8 |
| 66 | 2241 | 1843 | 398.4 |
| 67 | 1943 | 2461 | -518.1 |
| 68 | 1773 | 1887 | -114 |
| 69 | 2143 | 1722 | 420.9 |
| 70 | 2087 | 2140 | -53.03 |
| 71 | 1805 | 2141 | -335.7 |
| 72 | 1913 | 1590 | 323.2 |
| 73 | 2296 | 2053 | 242.8 |
| 74 | 2500 | 2549 | -49.4 |
| 75 | 2210 | 2268 | -58.35 |
| 76 | 2526 | 2483 | 43.42 |
| 77 | 2249 | 2306 | -57.25 |
| 78 | 2024 | 2043 | -18.57 |
| 79 | 2091 | 2216 | -125.4 |
| 80 | 2045 | 1861 | 184.1 |
| 81 | 1882 | 1939 | -57.01 |
| 82 | 1831 | 1917 | -86.37 |
| 83 | 1964 | 1866 | 97.74 |
| 84 | 1763 | 1716 | 47.48 |
| 85 | 1688 | 1986 | -298.3 |
| 86 | 2149 | 2061 | 88.28 |
| 87 | 1823 | 1998 | -174.8 |
| 88 | 2094 | 2297 | -203.5 |
| 89 | 2145 | 2034 | 111.1 |
| 90 | 1791 | 2003 | -211.8 |
| 91 | 1996 | 2115 | -118.6 |
| 92 | 2097 | 1779 | 318.3 |
| 93 | 1796 | 1993 | -197.5 |
| 94 | 1963 | 1855 | 107.9 |
| 95 | 2042 | 1917 | 125.3 |
| 96 | 1746 | 1770 | -23.5 |
| 97 | 2210 | 1926 | 284.4 |
| 98 | 2968 | 2380 | 588.1 |
| 99 | 3126 | 2572 | 553.5 |
| 100 | 3708 | 3111 | 597.4 |
| 101 | 3015 | 3027 | -11.71 |
| 102 | 1569 | 2395 | -825.9 |
| 103 | 1518 | 1643 | -125.4 |
| 104 | 1393 | 1227 | 166.3 |
| 105 | 1615 | 1500 | 114.6 |
| 106 | 1777 | 1766 | 10.75 |
| 107 | 1648 | 1901 | -252.5 |
| 108 | 1463 | 1499 | -35.77 |
| 109 | 1779 | 1722 | 57.5 |
| Goldfeld-Quandt test for Heteroskedasticity | |||
| p-values | Alternative Hypothesis | ||
| breakpoint index | greater | 2-sided | less |
| 19 | 0.4376 | 0.8753 | 0.5624 |
| 20 | 0.7029 | 0.5942 | 0.2971 |
| 21 | 0.5786 | 0.8428 | 0.4214 |
| 22 | 0.4489 | 0.8978 | 0.5511 |
| 23 | 0.5086 | 0.9827 | 0.4914 |
| 24 | 0.466 | 0.9321 | 0.534 |
| 25 | 0.3918 | 0.7837 | 0.6082 |
| 26 | 0.3259 | 0.6518 | 0.6741 |
| 27 | 0.3354 | 0.6707 | 0.6646 |
| 28 | 0.3256 | 0.6511 | 0.6744 |
| 29 | 0.6446 | 0.7109 | 0.3554 |
| 30 | 0.59 | 0.82 | 0.41 |
| 31 | 0.5309 | 0.9382 | 0.4691 |
| 32 | 0.4666 | 0.9331 | 0.5334 |
| 33 | 0.3949 | 0.7898 | 0.6051 |
| 34 | 0.4774 | 0.9548 | 0.5226 |
| 35 | 0.4288 | 0.8575 | 0.5712 |
| 36 | 0.3768 | 0.7537 | 0.6232 |
| 37 | 0.3116 | 0.6233 | 0.6884 |
| 38 | 0.489 | 0.9779 | 0.511 |
| 39 | 0.4684 | 0.9367 | 0.5316 |
| 40 | 0.4298 | 0.8596 | 0.5702 |
| 41 | 0.3845 | 0.769 | 0.6155 |
| 42 | 0.326 | 0.6519 | 0.674 |
| 43 | 0.3335 | 0.6671 | 0.6665 |
| 44 | 0.3018 | 0.6036 | 0.6982 |
| 45 | 0.3628 | 0.7257 | 0.6372 |
| 46 | 0.3219 | 0.6439 | 0.6781 |
| 47 | 0.2705 | 0.5409 | 0.7295 |
| 48 | 0.2187 | 0.4374 | 0.7813 |
| 49 | 0.1782 | 0.3565 | 0.8218 |
| 50 | 0.1458 | 0.2916 | 0.8542 |
| 51 | 0.128 | 0.2561 | 0.872 |
| 52 | 0.2633 | 0.5267 | 0.7367 |
| 53 | 0.5523 | 0.8953 | 0.4477 |
| 54 | 0.6595 | 0.6811 | 0.3405 |
| 55 | 0.7675 | 0.4649 | 0.2325 |
| 56 | 0.8539 | 0.2922 | 0.1461 |
| 57 | 0.8544 | 0.2912 | 0.1456 |
| 58 | 0.8304 | 0.3393 | 0.1696 |
| 59 | 0.7893 | 0.4215 | 0.2107 |
| 60 | 0.7423 | 0.5153 | 0.2577 |
| 61 | 0.697 | 0.606 | 0.303 |
| 62 | 0.7249 | 0.5502 | 0.2751 |
| 63 | 0.6711 | 0.6578 | 0.3289 |
| 64 | 0.6515 | 0.697 | 0.3485 |
| 65 | 0.6395 | 0.7209 | 0.3605 |
| 66 | 0.812 | 0.3761 | 0.188 |
| 67 | 0.8919 | 0.2161 | 0.1081 |
| 68 | 0.8575 | 0.285 | 0.1425 |
| 69 | 0.9092 | 0.1817 | 0.09084 |
| 70 | 0.8891 | 0.2217 | 0.1109 |
| 71 | 0.8674 | 0.2653 | 0.1326 |
| 72 | 0.9008 | 0.1983 | 0.09917 |
| 73 | 0.8802 | 0.2396 | 0.1198 |
| 74 | 0.8775 | 0.245 | 0.1225 |
| 75 | 0.8326 | 0.3349 | 0.1674 |
| 76 | 0.7817 | 0.4366 | 0.2183 |
| 77 | 0.7168 | 0.5663 | 0.2832 |
| 78 | 0.7954 | 0.4092 | 0.2046 |
| 79 | 0.7532 | 0.4936 | 0.2468 |
| 80 | 0.6959 | 0.6083 | 0.3041 |
| 81 | 0.612 | 0.776 | 0.388 |
| 82 | 0.5217 | 0.9566 | 0.4783 |
| 83 | 0.4931 | 0.9863 | 0.5069 |
| 84 | 0.3998 | 0.7996 | 0.6002 |
| 85 | 0.3934 | 0.7868 | 0.6066 |
| 86 | 0.3082 | 0.6164 | 0.6918 |
| 87 | 0.4222 | 0.8444 | 0.5778 |
| 88 | 0.817 | 0.3659 | 0.183 |
| 89 | 0.9389 | 0.1222 | 0.06112 |
| 90 | 0.8777 | 0.2445 | 0.1223 |
| Meta Analysis of Goldfeld-Quandt test for Heteroskedasticity | |||
| Description | # significant tests | % significant tests | OK/NOK |
| 1% type I error level | 0 | 0 | OK |
| 5% type I error level | 0 | 0 | OK |
| 10% type I error level | 0 | 0 | OK |
| Ramsey RESET F-Test for powers (2 and 3) of fitted values |
> reset_test_fitted RESET test data: mylm RESET = 3.5773, df1 = 2, df2 = 91, p-value = 0.03195 |
| Ramsey RESET F-Test for powers (2 and 3) of regressors |
> reset_test_regressors RESET test data: mylm RESET = 0.72655, df1 = 30, df2 = 63, p-value = 0.8302 |
| Ramsey RESET F-Test for powers (2 and 3) of principal components |
> reset_test_principal_components RESET test data: mylm RESET = 6.2591, df1 = 2, df2 = 91, p-value = 0.002839 |
| Variance Inflation Factors (Multicollinearity) |
> vif
`bouwvergunningen(t-1)` `bouwvergunningen(t-2)` `bouwvergunningen(t-3)`
               2.576087                3.815185                2.509704
                     M1                      M2                      M3
               1.980365                1.898567                1.940463
                     M4                      M5                      M6
               1.941558                2.056594                2.024735
                     M7                      M8                      M9
               2.002387                1.974384                1.951396
                    M10                     M11                       t
               1.933338                1.842257                1.246279
|