| Pearson Product Moment Correlation - Ungrouped Data | ||
| Statistic | Variable X | Variable Y |
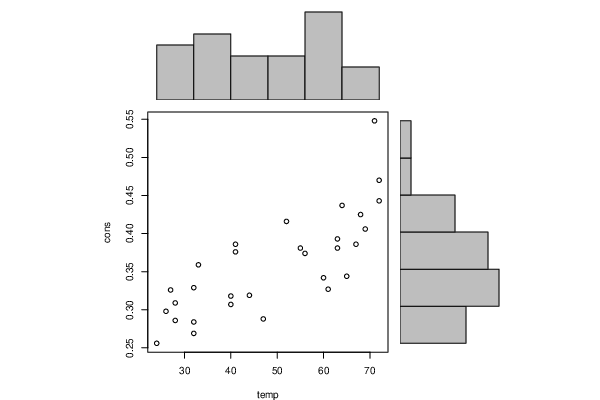
| Mean | 49.1 | 0.359433333333333 |
| Biased Variance | 260.69 | 0.00418411222222222 |
| Biased Standard Deviation | 16.1458973117012 | 0.0646847139765047 |
| Covariance | 0.837989655172414 | |
| Correlation | 0.775624559873081 | |
| Determination | 0.60159345787831 | |
| T-Test | 6.50230500910473 | |
| p-value (2 sided) | 4.78921470453824e-07 | |
| p-value (1 sided) | 2.39460735226912e-07 | |
| 95% CI of Correlation | [0.576429001207779, 0.887809833723072] | |
| Degrees of Freedom | 28 | |
| Number of Observations | 30 | |
| Normality Tests |
> jarque.x Jarque-Bera Normality Test data: x JB = 2.839, p-value = 0.2418 alternative hypothesis: greater |
> jarque.y Jarque-Bera Normality Test data: y JB = 3.0385, p-value = 0.2189 alternative hypothesis: greater |
> ad.x Anderson-Darling normality test data: x A = 0.95166, p-value = 0.01397 |
> ad.y Anderson-Darling normality test data: y A = 0.33422, p-value = 0.4894 |