| Multiple Linear Regression - Estimated Regression Equation |
| AllSuicides[t] = + 745.869 + 2.74418totalmo[t] + 367.372`1`[t] + 419.134`3`[t] + 348.255`4`[t] + 387.289`5`[t] + 232.414`6`[t] + 352.327`7`[t] + 288.718`8`[t] + 133.153`9`[t] + 223.784`10`[t] + 61.7883`11`[t] + 69.3017`12`[t] + 449.197rw[t] + 0.336478`AllSuicides(t-1)`[t] + 0.235723`AllSuicides(t-2)`[t] + e[t] |
| Multiple Linear Regression - Ordinary Least Squares | |||||
| Variable | Parameter | S.D. | T-STAT H0: parameter = 0 | 2-tail p-value | 1-tail p-value |
| (Intercept) | +745.9 | 136.1 | +5.4810e+00 | 1.361e-07 | 6.804e-08 |
| totalmo | +2.744 | 0.4143 | +6.6230e+00 | 3.676e-10 | 1.838e-10 |
| `1` | +367.4 | 34.11 | +1.0770e+01 | 2.474e-21 | 1.237e-21 |
| `3` | +419.1 | 41.54 | +1.0090e+01 | 2.273e-19 | 1.137e-19 |
| `4` | +348.2 | 29.46 | +1.1820e+01 | 2.083e-24 | 1.042e-24 |
| `5` | +387.3 | 34.07 | +1.1370e+01 | 4.437e-23 | 2.219e-23 |
| `6` | +232.4 | 32.89 | +7.0670e+00 | 3.088e-11 | 1.544e-11 |
| `7` | +352.3 | 37.91 | +9.2930e+00 | 4.055e-17 | 2.028e-17 |
| `8` | +288.7 | 33.2 | +8.6970e+00 | 1.774e-15 | 8.87e-16 |
| `9` | +133.2 | 36.86 | +3.6130e+00 | 0.0003898 | 0.0001949 |
| `10` | +223.8 | 37.47 | +5.9730e+00 | 1.161e-08 | 5.807e-09 |
| `11` | +61.79 | 32.26 | +1.9160e+00 | 0.05695 | 0.02848 |
| `12` | +69.3 | 37.5 | +1.8480e+00 | 0.06615 | 0.03308 |
| rw | +449.2 | 61.57 | +7.2960e+00 | 8.305e-12 | 4.153e-12 |
| `AllSuicides(t-1)` | +0.3365 | 0.06433 | +5.2300e+00 | 4.531e-07 | 2.265e-07 |
| `AllSuicides(t-2)` | +0.2357 | 0.0638 | +3.6950e+00 | 0.0002895 | 0.0001447 |
| Multiple Linear Regression - Regression Statistics | |
| Multiple R | 0.9825 |
| R-squared | 0.9653 |
| Adjusted R-squared | 0.9625 |
| F-TEST (value) | 344.5 |
| F-TEST (DF numerator) | 15 |
| F-TEST (DF denominator) | 186 |
| p-value | 0 |
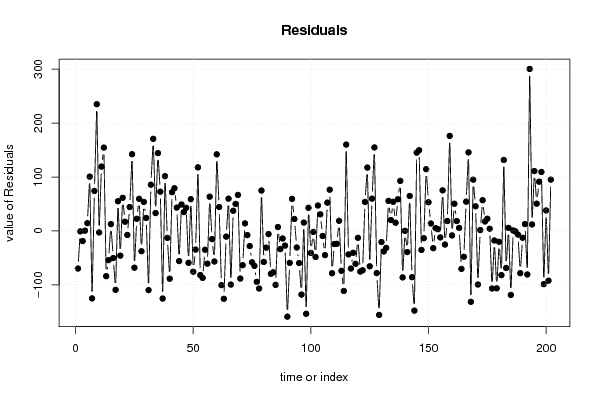
| Multiple Linear Regression - Residual Statistics | |
| Residual Standard Deviation | 82.03 |
| Sum Squared Residuals | 1.252e+06 |
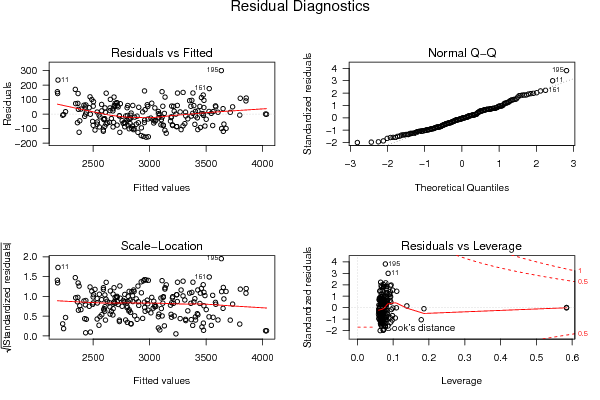
| Menu of Residual Diagnostics | |
| Description | Link |
| Histogram | Compute |
| Central Tendency | Compute |
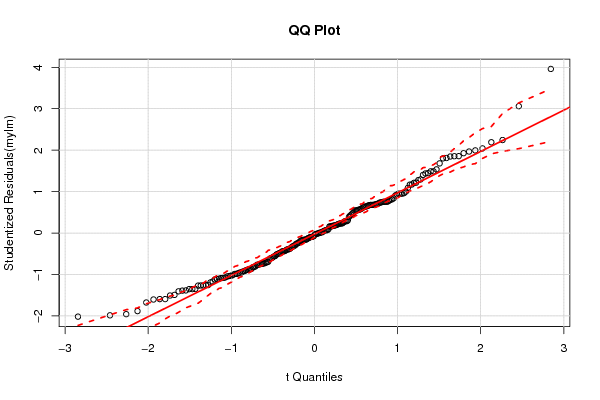
| QQ Plot | Compute |
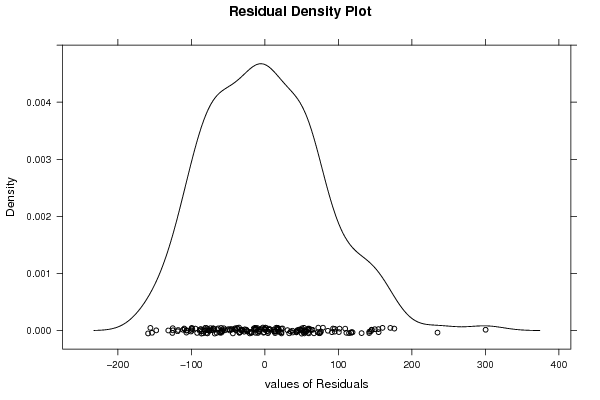
| Kernel Density Plot | Compute |
| Skewness/Kurtosis Test | Compute |
| Skewness-Kurtosis Plot | Compute |
| Harrell-Davis Plot | Compute |
| Bootstrap Plot -- Central Tendency | Compute |
| Blocked Bootstrap Plot -- Central Tendency | Compute |
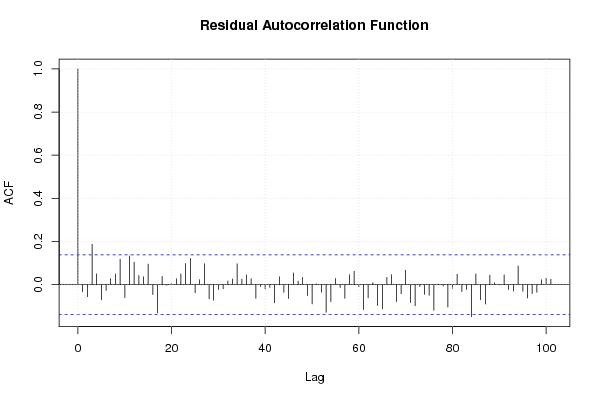
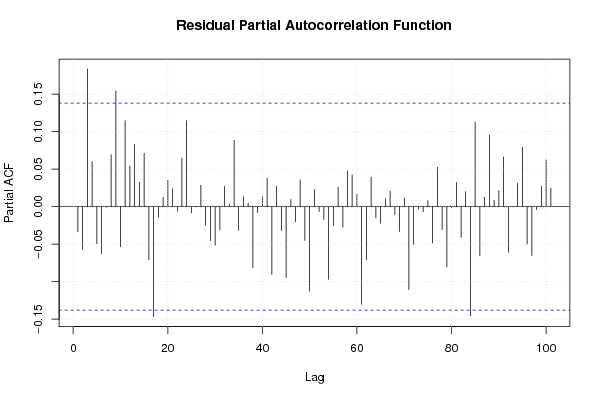
| (Partial) Autocorrelation Plot | Compute |
| Spectral Analysis | Compute |
| Tukey lambda PPCC Plot | Compute |
| Box-Cox Normality Plot | Compute |
| Summary Statistics | Compute |
| Ramsey RESET F-Test for powers (2 and 3) of fitted values |
> reset_test_fitted RESET test data: mylm RESET = 17.446, df1 = 2, df2 = 184, p-value = 1.154e-07 |
| Ramsey RESET F-Test for powers (2 and 3) of regressors |
> reset_test_regressors RESET test data: mylm RESET = 0.63812, df1 = 30, df2 = 156, p-value = 0.9257 |
| Ramsey RESET F-Test for powers (2 and 3) of principal components |
> reset_test_principal_components RESET test data: mylm RESET = 9.0826, df1 = 2, df2 = 184, p-value = 0.0001731 |
| Variance Inflation Factors (Multicollinearity) |
> vif
           totalmo                `1`                `3`                `4`
         17.523818           2.546944           3.992335           2.008438
               `5`                `6`                `7`                `8`
          2.684985           2.502452           3.325742           2.549725
               `9`               `10`               `11`               `12`
          3.142910           3.247754           2.407114           3.252767
                rw `AllSuicides(t-1)` `AllSuicides(t-2)`
          1.115366          22.281816          21.952108
|