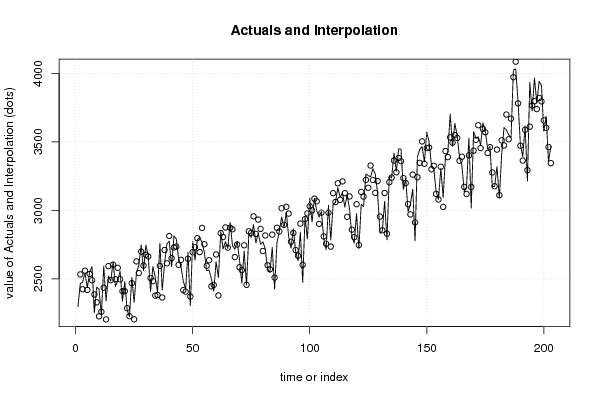
| Multiple Linear Regression - Estimated Regression Equation |
| AllSuicides[t] = + 1055.95 + 3.32787totalmo[t] + 262.534`1`[t] -143.16`2`[t] + 364.679`3`[t] + 171.553`4`[t] + 299.318`5`[t] + 123.189`6`[t] + 288.252`7`[t] + 183.248`8`[t] + 57.2869`9`[t] + 159.044`10`[t] -37.3843`11`[t] + 413.512rw[t] + 0.479691`AllSuicides(t-1)`[t] + e[t] |
| Multiple Linear Regression - Ordinary Least Squares | |||||
| Variable | Parameter | S.D. | T-STAT H0: parameter = 0 | 2-tail p-value | 1-tail p-value |
| (Intercept) | +1056 | 120.9 | +8.7320e+00 | 1.355e-15 | 6.773e-16 |
| totalmo | +3.328 | 0.3787 | +8.7880e+00 | 9.506e-16 | 4.753e-16 |
| `1` | +262.5 | 30.02 | +8.7460e+00 | 1.234e-15 | 6.169e-16 |
| `2` | -143.2 | 31.28 | -4.5760e+00 | 8.581e-06 | 4.291e-06 |
| `3` | +364.7 | 29.98 | +1.2170e+01 | 1.716e-25 | 8.581e-26 |
| `4` | +171.6 | 32.81 | +5.2290e+00 | 4.506e-07 | 2.253e-07 |
| `5` | +299.3 | 32.37 | +9.2470e+00 | 5.107e-17 | 2.554e-17 |
| `6` | +123.2 | 35.7 | +3.4510e+00 | 0.00069 | 0.000345 |
| `7` | +288.2 | 32.37 | +8.9050e+00 | 4.525e-16 | 2.263e-16 |
| `8` | +183.2 | 35.33 | +5.1860e+00 | 5.519e-07 | 2.76e-07 |
| `9` | +57.29 | 34.47 | +1.6620e+00 | 0.0982 | 0.0491 |
| `10` | +159 | 31.08 | +5.1170e+00 | 7.641e-07 | 3.82e-07 |
| `11` | -37.38 | 31.28 | -1.1950e+00 | 0.2335 | 0.1167 |
| rw | +413.5 | 63.44 | +6.5190e+00 | 6.35e-10 | 3.175e-10 |
| `AllSuicides(t-1)` | +0.4797 | 0.05616 | +8.5420e+00 | 4.434e-15 | 2.217e-15 |
| Multiple Linear Regression - Regression Statistics | |
| Multiple R | 0.9809 |
| R-squared | 0.9622 |
| Adjusted R-squared | 0.9594 |
| F-TEST (value) | 342 |
| F-TEST (DF numerator) | 14 |
| F-TEST (DF denominator) | 188 |
| p-value | 0 |
| Multiple Linear Regression - Residual Statistics | |
| Residual Standard Deviation | 85.62 |
| Sum Squared Residuals | 1.378e+06 |
| Menu of Residual Diagnostics | |
| Description | Link |
| Histogram | Compute |
| Central Tendency | Compute |
| QQ Plot | Compute |
| Kernel Density Plot | Compute |
| Skewness/Kurtosis Test | Compute |
| Skewness-Kurtosis Plot | Compute |
| Harrell-Davis Plot | Compute |
| Bootstrap Plot -- Central Tendency | Compute |
| Blocked Bootstrap Plot -- Central Tendency | Compute |
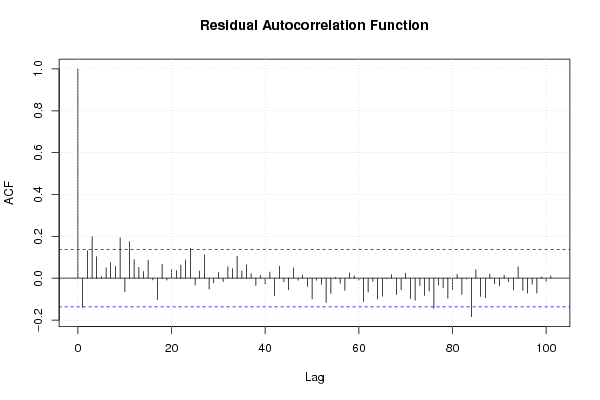
| (Partial) Autocorrelation Plot | Compute |
| Spectral Analysis | Compute |
| Tukey lambda PPCC Plot | Compute |
| Box-Cox Normality Plot | Compute |
| Summary Statistics | Compute |
| Ramsey RESET F-Test for powers (2 and 3) of fitted values |
> reset_test_fitted RESET test data: mylm RESET = 20.788, df1 = 2, df2 = 186, p-value = 7.113e-09 |
| Ramsey RESET F-Test for powers (2 and 3) of regressors |
> reset_test_regressors RESET test data: mylm RESET = 0.66262, df1 = 28, df2 = 160, p-value = 0.8998 |
| Ramsey RESET F-Test for powers (2 and 3) of principal components |
> reset_test_principal_components RESET test data: mylm RESET = 5.3891, df1 = 2, df2 = 186, p-value = 0.005307 |
| Variance Inflation Factors (Multicollinearity) |
> vif
           totalmo                `1`                `2`                `3`
         13.635805           1.811285           2.079140           1.909123
               `4`                `5`                `6`                `7`
          2.286469           2.226140           2.707447           2.226067
               `8`                `9`               `10`               `11`
          2.652377           2.524423           2.052736           2.078342
                rw `AllSuicides(t-1)`
          1.086899          15.676222
|