| Multiple Linear Regression - Estimated Regression Equation |
| AllSuicides[t] = + 1318.48 + 3.32787totalmo[t] -405.694`2`[t] + 102.145`3`[t] -90.9806`4`[t] + 36.7845`5`[t] -139.344`6`[t] + 25.7187`7`[t] -79.2862`8`[t] -205.247`9`[t] -103.49`10`[t] -299.918`11`[t] + 413.512`12`[t] -262.534rw[t] + 0.479691`AllSuicides(t-1)`[t] + e[t] |
| Multiple Linear Regression - Ordinary Least Squares | |||||
| Variable | Parameter | S.D. | T-STAT H0: parameter = 0 | 2-tail p-value | 1-tail p-value |
| (Intercept) | +1318 | 117.7 | +1.1200e+01 | 1.233e-22 | 6.165e-23 |
| totalmo | +3.328 | 0.3787 | +8.7880e+00 | 9.506e-16 | 4.753e-16 |
| `2` | -405.7 | 32.98 | -1.2300e+01 | 6.811e-26 | 3.406e-26 |
| `3` | +102.2 | 29.94 | +3.4120e+00 | 0.0007901 | 0.000395 |
| `4` | -90.98 | 34.81 | -2.6140e+00 | 0.009679 | 0.00484 |
| `5` | +36.78 | 34.3 | +1.0720e+00 | 0.2849 | 0.1425 |
| `6` | -139.3 | 38.05 | -3.6620e+00 | 0.0003254 | 0.0001627 |
| `7` | +25.72 | 34.3 | +7.4970e-01 | 0.4544 | 0.2272 |
| `8` | -79.29 | 37.62 | -2.1080e+00 | 0.03638 | 0.01819 |
| `9` | -205.2 | 36.66 | -5.5990e+00 | 7.57e-08 | 3.785e-08 |
| `10` | -103.5 | 32.75 | -3.1600e+00 | 0.00184 | 0.0009198 |
| `11` | -299.9 | 32.99 | -9.0900e+00 | 1.396e-16 | 6.982e-17 |
| `12` | +413.5 | 63.44 | +6.5190e+00 | 6.35e-10 | 3.175e-10 |
| rw | -262.5 | 30.02 | -8.7460e+00 | 1.234e-15 | 6.169e-16 |
| `AllSuicides(t-1)` | +0.4797 | 0.05616 | +8.5420e+00 | 4.434e-15 | 2.217e-15 |
| Multiple Linear Regression - Regression Statistics | |
| Multiple R | 0.9809 |
| R-squared | 0.9622 |
| Adjusted R-squared | 0.9594 |
| F-TEST (value) | 342 |
| F-TEST (DF numerator) | 14 |
| F-TEST (DF denominator) | 188 |
| p-value | 0 |
| Multiple Linear Regression - Residual Statistics | |
| Residual Standard Deviation | 85.62 |
| Sum Squared Residuals | 1.378e+06 |
| Menu of Residual Diagnostics | |
| Description | Link |
| Histogram | Compute |
| Central Tendency | Compute |
| QQ Plot | Compute |
| Kernel Density Plot | Compute |
| Skewness/Kurtosis Test | Compute |
| Skewness-Kurtosis Plot | Compute |
| Harrell-Davis Plot | Compute |
| Bootstrap Plot -- Central Tendency | Compute |
| Blocked Bootstrap Plot -- Central Tendency | Compute |
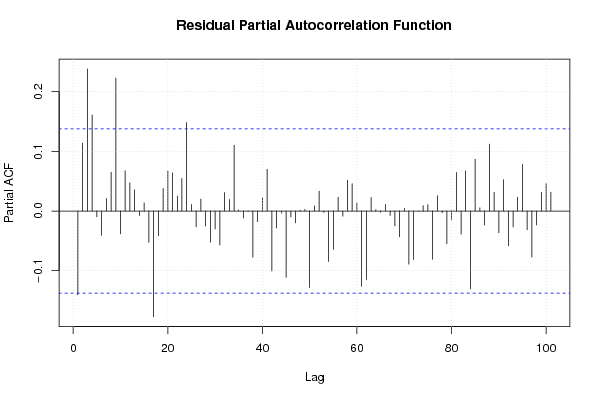
| (Partial) Autocorrelation Plot | Compute |
| Spectral Analysis | Compute |
| Tukey lambda PPCC Plot | Compute |
| Box-Cox Normality Plot | Compute |
| Summary Statistics | Compute |
| Ramsey RESET F-Test for powers (2 and 3) of fitted values |
> reset_test_fitted RESET test data: mylm RESET = 20.788, df1 = 2, df2 = 186, p-value = 7.113e-09 |
| Ramsey RESET F-Test for powers (2 and 3) of regressors |
> reset_test_regressors RESET test data: mylm RESET = 0.66262, df1 = 28, df2 = 160, p-value = 0.8998 |
| Ramsey RESET F-Test for powers (2 and 3) of principal components |
> reset_test_principal_components RESET test data: mylm RESET = 5.3891, df1 = 2, df2 = 186, p-value = 0.005307 |
| Variance Inflation Factors (Multicollinearity) |
> vif
           totalmo                `2`                `3`                `4`
         13.635805           2.311204           1.904303           2.574082
               `5`                `6`                `7`                `8`
          2.499721           3.076519           2.500224           3.006334
               `9`               `10`               `11`               `12`
          2.855460           2.278873           2.312926           1.086899
                rw `AllSuicides(t-1)`
          1.914198          15.676222
|