| Multiple Linear Regression - Estimated Regression Equation |
| Partner[t] = + 0.578712 + 0.198045Work[t] + 0.00504333Age[t] -0.418919Gender[t] -0.623991`Race/White`[t] -0.356247`Race/Black`[t] -0.422443`Race/Latino`[t] -0.219183English[t] -0.0624936Club[t] + 0.00969209Classes[t] -3.7576e-05Height[t] + 0.0415028Glasses[t] + 0.11093GPA[t] + 0.25192`Partner/HS\r`[t] + e[t] |
| Multiple Linear Regression - Ordinary Least Squares | |||||
| Variable | Parameter | S.D. | T-STAT H0: parameter = 0 | 2-tail p-value | 1-tail p-value |
| (Intercept) | +0.5787 | 1.31 | +4.4170e-01 | 0.6608 | 0.3304 |
| Work | +0.198 | 0.1358 | +1.4580e+00 | 0.1517 | 0.07584 |
| Age | +0.005043 | 0.03735 | +1.3500e-01 | 0.8932 | 0.4466 |
| Gender | -0.4189 | 0.1371 | -3.0550e+00 | 0.003743 | 0.001871 |
| `Race/White` | -0.624 | 0.2435 | -2.5620e+00 | 0.01373 | 0.006867 |
| `Race/Black` | -0.3563 | 0.3461 | -1.0290e+00 | 0.3087 | 0.1544 |
| `Race/Latino` | -0.4224 | 0.25 | -1.6900e+00 | 0.09788 | 0.04894 |
| English | -0.2192 | 0.2071 | -1.0580e+00 | 0.2954 | 0.1477 |
| Club | -0.06249 | 0.1372 | -4.5550e-01 | 0.6509 | 0.3255 |
| Classes | +0.009692 | 0.05721 | +1.6940e-01 | 0.8662 | 0.4331 |
| Height | -3.758e-05 | 0.007578 | -4.9580e-03 | 0.9961 | 0.498 |
| Glasses | +0.0415 | 0.1378 | +3.0130e-01 | 0.7646 | 0.3823 |
| GPA | +0.1109 | 0.1826 | +6.0760e-01 | 0.5464 | 0.2732 |
| `Partner/HS\r` | +0.2519 | 0.142 | +1.7740e+00 | 0.08263 | 0.04132 |
| Multiple Linear Regression - Regression Statistics | |
| Multiple R | 0.5826 |
| R-squared | 0.3394 |
| Adjusted R-squared | 0.1527 |
| F-TEST (value) | 1.818 |
| F-TEST (DF numerator) | 13 |
| F-TEST (DF denominator) | 46 |
| p-value | 0.06872 |
| Multiple Linear Regression - Residual Statistics | |
| Residual Standard Deviation | 0.4639 |
| Sum Squared Residuals | 9.898 |
| Menu of Residual Diagnostics | |
| Description | Link |
| Histogram | Compute |
| Central Tendency | Compute |
| QQ Plot | Compute |
| Kernel Density Plot | Compute |
| Skewness/Kurtosis Test | Compute |
| Skewness-Kurtosis Plot | Compute |
| Harrell-Davis Plot | Compute |
| Bootstrap Plot -- Central Tendency | Compute |
| Blocked Bootstrap Plot -- Central Tendency | Compute |
| (Partial) Autocorrelation Plot | Compute |
| Spectral Analysis | Compute |
| Tukey lambda PPCC Plot | Compute |
| Box-Cox Normality Plot | Compute |
| Summary Statistics | Compute |
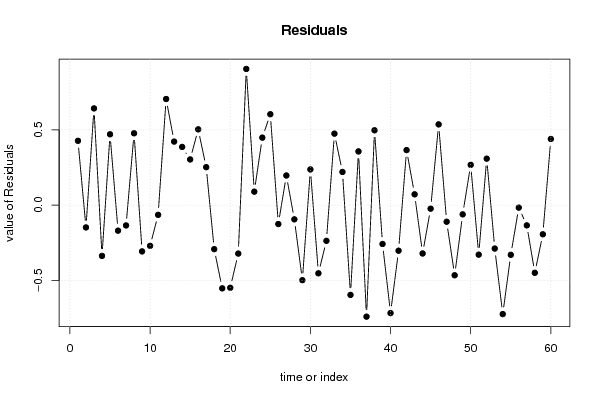
| Multiple Linear Regression - Actuals, Interpolation, and Residuals | |||
| Time or Index | Actuals | Interpolation Forecast | Residuals Prediction Error |
| 1 | 1 | 0.5723 | 0.4277 |
| 2 | 0 | 0.1481 | -0.1481 |
| 3 | 1 | 0.3566 | 0.6434 |
| 4 | 0 | 0.3373 | -0.3373 |
| 5 | 1 | 0.5289 | 0.4711 |
| 6 | 0 | 0.1696 | -0.1696 |
| 7 | 0 | 0.1348 | -0.1348 |
| 8 | 1 | 0.5222 | 0.4778 |
| 9 | 0 | 0.3075 | -0.3075 |
| 10 | 0 | 0.2707 | -0.2707 |
| 11 | 0 | 0.06436 | -0.06436 |
| 12 | 1 | 0.2943 | 0.7057 |
| 13 | 1 | 0.5773 | 0.4227 |
| 14 | 1 | 0.6129 | 0.3871 |
| 15 | 1 | 0.6961 | 0.3039 |
| 16 | 1 | 0.496 | 0.504 |
| 17 | 1 | 0.7475 | 0.2525 |
| 18 | 1 | 1.293 | -0.2926 |
| 19 | 0 | 0.5532 | -0.5532 |
| 20 | 0 | 0.5492 | -0.5492 |
| 21 | 0 | 0.3219 | -0.3219 |
| 22 | 1 | 0.09442 | 0.9056 |
| 23 | 1 | 0.9102 | 0.0898 |
| 24 | 1 | 0.5511 | 0.4489 |
| 25 | 1 | 0.3955 | 0.6045 |
| 26 | 0 | 0.1256 | -0.1256 |
| 27 | 1 | 0.8028 | 0.1972 |
| 28 | 0 | 0.09446 | -0.09446 |
| 29 | 0 | 0.4986 | -0.4986 |
| 30 | 1 | 0.7625 | 0.2375 |
| 31 | 0 | 0.4531 | -0.4531 |
| 32 | 0 | 0.2372 | -0.2372 |
| 33 | 1 | 0.5246 | 0.4754 |
| 34 | 1 | 0.7793 | 0.2207 |
| 35 | 0 | 0.5966 | -0.5966 |
| 36 | 1 | 0.6429 | 0.3571 |
| 37 | 0 | 0.7413 | -0.7413 |
| 38 | 1 | 0.5022 | 0.4978 |
| 39 | 1 | 1.258 | -0.2581 |
| 40 | 0 | 0.7176 | -0.7176 |
| 41 | 0 | 0.3027 | -0.3027 |
| 42 | 1 | 0.6339 | 0.3661 |
| 43 | 1 | 0.928 | 0.07195 |
| 44 | 0 | 0.3214 | -0.3214 |
| 45 | 1 | 1.023 | -0.02337 |
| 46 | 1 | 0.463 | 0.537 |
| 47 | 0 | 0.1101 | -0.1101 |
| 48 | 0 | 0.4661 | -0.4661 |
| 49 | 0 | 0.06118 | -0.06118 |
| 50 | 1 | 0.732 | 0.268 |
| 51 | 0 | 0.329 | -0.329 |
| 52 | 1 | 0.6909 | 0.3091 |
| 53 | 0 | 0.2886 | -0.2886 |
| 54 | 0 | 0.7244 | -0.7244 |
| 55 | 0 | 0.3301 | -0.3301 |
| 56 | 1 | 1.016 | -0.01642 |
| 57 | 1 | 1.134 | -0.1344 |
| 58 | 0 | 0.4497 | -0.4497 |
| 59 | 0 | 0.1937 | -0.1937 |
| 60 | 1 | 0.56 | 0.44 |
| Goldfeld-Quandt test for Heteroskedasticity | |||
| p-values | Alternative Hypothesis | ||
| breakpoint index | greater | 2-sided | less |
| 17 | 0.5054 | 0.9892 | 0.4946 |
| 18 | 0.356 | 0.7119 | 0.644 |
| 19 | 0.4028 | 0.8056 | 0.5972 |
| 20 | 0.2834 | 0.5667 | 0.7166 |
| 21 | 0.4471 | 0.8942 | 0.5529 |
| 22 | 0.833 | 0.334 | 0.167 |
| 23 | 0.7609 | 0.4782 | 0.2391 |
| 24 | 0.8719 | 0.2562 | 0.1281 |
| 25 | 0.9216 | 0.1569 | 0.07843 |
| 26 | 0.8869 | 0.2262 | 0.1131 |
| 27 | 0.8323 | 0.3354 | 0.1677 |
| 28 | 0.8186 | 0.3628 | 0.1814 |
| 29 | 0.7841 | 0.4318 | 0.2159 |
| 30 | 0.7947 | 0.4105 | 0.2053 |
| 31 | 0.8406 | 0.3187 | 0.1594 |
| 32 | 0.7855 | 0.429 | 0.2145 |
| 33 | 0.7913 | 0.4173 | 0.2087 |
| 34 | 0.7189 | 0.5621 | 0.2811 |
| 35 | 0.7643 | 0.4714 | 0.2357 |
| 36 | 0.6742 | 0.6516 | 0.3258 |
| 37 | 0.6824 | 0.6352 | 0.3176 |
| 38 | 0.7475 | 0.505 | 0.2525 |
| 39 | 0.6473 | 0.7055 | 0.3527 |
| 40 | 0.8453 | 0.3094 | 0.1547 |
| 41 | 0.8159 | 0.3682 | 0.1841 |
| 42 | 0.7013 | 0.5975 | 0.2987 |
| 43 | 0.7014 | 0.5972 | 0.2986 |
| Meta Analysis of Goldfeld-Quandt test for Heteroskedasticity | |||
| Description | # significant tests | % significant tests | OK/NOK |
| 1% type I error level | 0 | 0 | OK |
| 5% type I error level | 0 | 0 | OK |
| 10% type I error level | 0 | 0 | OK |
| Ramsey RESET F-Test for powers (2 and 3) of fitted values |
> reset_test_fitted RESET test data: mylm RESET = 1.6084, df1 = 2, df2 = 44, p-value = 0.2117 |
| Ramsey RESET F-Test for powers (2 and 3) of regressors |
> reset_test_regressors RESET test data: mylm RESET = 0.3404, df1 = 26, df2 = 20, p-value = 0.9946 |
| Ramsey RESET F-Test for powers (2 and 3) of principal components |
> reset_test_principal_components RESET test data: mylm RESET = 0.87781, df1 = 2, df2 = 44, p-value = 0.4228 |
| Variance Inflation Factors (Multicollinearity) |
> vif
           Work             Age          Gender    `Race/White`    `Race/Black`
       1.273615        1.335402        1.298122        3.761883        2.078339
  `Race/Latino`         English            Club         Classes          Height
       2.610058        1.525026        1.219037        1.199213        1.208974
        Glasses             GPA `Partner/HS\\r`
       1.145021        1.196125        1.141449
|