Free Statistics
of Irreproducible Research!
Description of Statistical Computation | ||||||||||||||||||||||||||||||||||||||||||||||
|---|---|---|---|---|---|---|---|---|---|---|---|---|---|---|---|---|---|---|---|---|---|---|---|---|---|---|---|---|---|---|---|---|---|---|---|---|---|---|---|---|---|---|---|---|---|---|
| Author's title | ||||||||||||||||||||||||||||||||||||||||||||||
| Author | *The author of this computation has been verified* | |||||||||||||||||||||||||||||||||||||||||||||
| R Software Module | rwasp_spearman.wasp | |||||||||||||||||||||||||||||||||||||||||||||
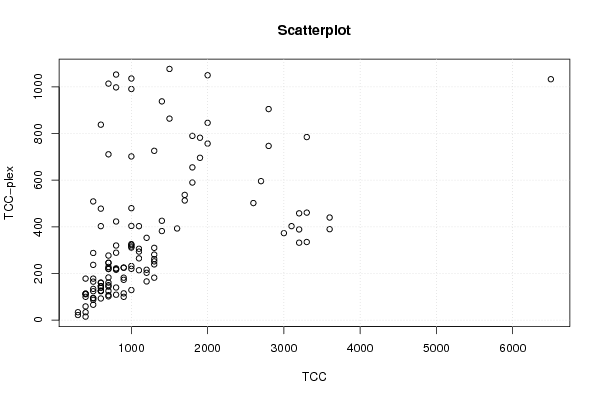
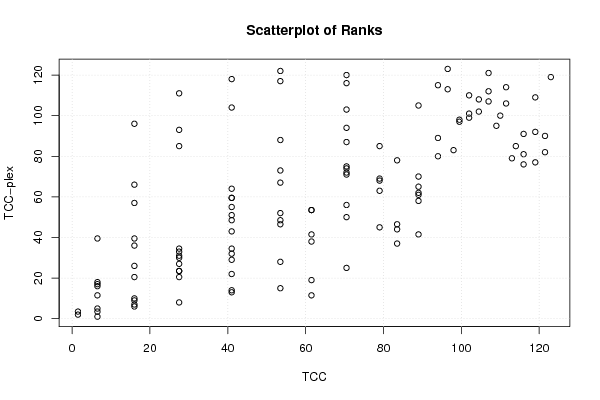
| Title produced by software | Spearman Rank Correlation | |||||||||||||||||||||||||||||||||||||||||||||
| Date of computation | Mon, 02 Apr 2018 20:24:09 +0200 | |||||||||||||||||||||||||||||||||||||||||||||
| Cite this page as follows | Statistical Computations at FreeStatistics.org, Office for Research Development and Education, URL https://freestatistics.org/blog/index.php?v=date/2018/Apr/02/t1522693705pauurqq5gjw0haj.htm/, Retrieved Mon, 29 Apr 2024 15:36:40 +0200 | |||||||||||||||||||||||||||||||||||||||||||||
| Statistical Computations at FreeStatistics.org, Office for Research Development and Education, URL https://freestatistics.org/blog/index.php?pk=, Retrieved Mon, 29 Apr 2024 15:36:40 +0200 | ||||||||||||||||||||||||||||||||||||||||||||||
| QR Codes: | ||||||||||||||||||||||||||||||||||||||||||||||
|
| ||||||||||||||||||||||||||||||||||||||||||||||
| Original text written by user: | ||||||||||||||||||||||||||||||||||||||||||||||
| IsPrivate? | This computation is/was private until 2019-12-31 | |||||||||||||||||||||||||||||||||||||||||||||
| User-defined keywords | ||||||||||||||||||||||||||||||||||||||||||||||
| Estimated Impact | 0 | |||||||||||||||||||||||||||||||||||||||||||||
Tree of Dependent Computations | ||||||||||||||||||||||||||||||||||||||||||||||
Dataset | ||||||||||||||||||||||||||||||||||||||||||||||
| Dataseries X: | ||||||||||||||||||||||||||||||||||||||||||||||
3300 3600 3200 3000 3200 3300 3100 3300 3600 500 700 700 800 800 800 1000 1200 1000 1100 500 600 700 500 600 600 700 400 500 800 900 1000 400 700 600 600 700 500 400 500 600 6500 500 700 700 700 700 700 800 900 1000 800 1200 1100 1000 1000 1100 1200 1300 700 1300 1200 1300 1300 1300 600 600 600 700 3200 400 900 900 900 1000 900 800 400 400 300 500 500 500 400 300 400 1900 1800 2000 1800 1400 1000 800 700 2000 2600 2700 2800 2000 1500 1000 800 1900 2800 1600 1400 1000 600 500 1100 1400 1300 1100 800 600 1000 1800 1700 1300 1000 700 600 1500 1700 | ||||||||||||||||||||||||||||||||||||||||||||||
| Dataseries Y: | ||||||||||||||||||||||||||||||||||||||||||||||
785 390 332 373 389 461 403 335 440 237 277 246 320 216 289 322 353 316 403 134 146 150 165 160 161 144 178 178 219 225 311 59 125 126 138 161 94 111 124 145 1033 288 221 183 228 219 246 222 225 404 140 203 214 232 220 265 216 310 107 182 166 262 239 252 126 124 93 102 458 113 115 173 182 129 100 109 114 100 22 66 87 95 15 34 34 782 655 846 790 938 991 998 1014 757 502 596 747 1050 1077 1036 1053 696 905 393 382 480 403 509 294 426 281 306 423 478 326 590 537 726 702 711 838 864 513 | ||||||||||||||||||||||||||||||||||||||||||||||
Tables (Output of Computation) | ||||||||||||||||||||||||||||||||||||||||||||||
| ||||||||||||||||||||||||||||||||||||||||||||||
Figures (Output of Computation) | ||||||||||||||||||||||||||||||||||||||||||||||
Input Parameters & R Code | ||||||||||||||||||||||||||||||||||||||||||||||
| Parameters (Session): | ||||||||||||||||||||||||||||||||||||||||||||||
| Parameters (R input): | ||||||||||||||||||||||||||||||||||||||||||||||
| R code (references can be found in the software module): | ||||||||||||||||||||||||||||||||||||||||||||||
k <- cor.test(x,y,method='spearman') | ||||||||||||||||||||||||||||||||||||||||||||||