Free Statistics
of Irreproducible Research!
Description of Statistical Computation | ||||||||||||||||||||||||||||||||||||||||||||||||
|---|---|---|---|---|---|---|---|---|---|---|---|---|---|---|---|---|---|---|---|---|---|---|---|---|---|---|---|---|---|---|---|---|---|---|---|---|---|---|---|---|---|---|---|---|---|---|---|---|
| Author's title | ||||||||||||||||||||||||||||||||||||||||||||||||
| Author | *The author of this computation has been verified* | |||||||||||||||||||||||||||||||||||||||||||||||
| R Software Module | rwasp_fitdistrnorm.wasp | |||||||||||||||||||||||||||||||||||||||||||||||
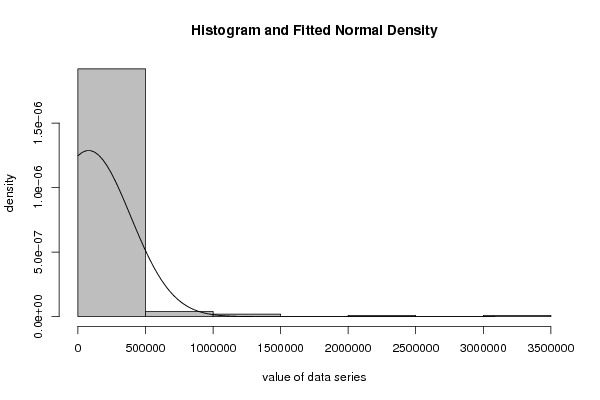
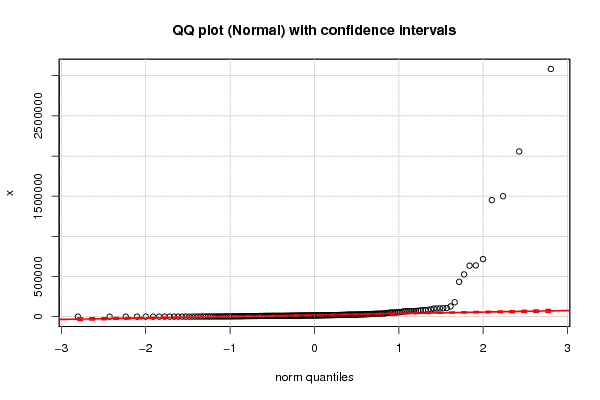
| Title produced by software | ML Fitting and QQ Plot- Normal Distribution | |||||||||||||||||||||||||||||||||||||||||||||||
| Date of computation | Wed, 29 Nov 2017 14:11:40 +0100 | |||||||||||||||||||||||||||||||||||||||||||||||
| Cite this page as follows | Statistical Computations at FreeStatistics.org, Office for Research Development and Education, URL https://freestatistics.org/blog/index.php?v=date/2017/Nov/29/t1511961124h7px8z5f5b1gzi4.htm/, Retrieved Sat, 18 May 2024 14:42:00 +0000 | |||||||||||||||||||||||||||||||||||||||||||||||
| Statistical Computations at FreeStatistics.org, Office for Research Development and Education, URL https://freestatistics.org/blog/index.php?pk=308314, Retrieved Sat, 18 May 2024 14:42:00 +0000 | ||||||||||||||||||||||||||||||||||||||||||||||||
| QR Codes: | ||||||||||||||||||||||||||||||||||||||||||||||||
|
| ||||||||||||||||||||||||||||||||||||||||||||||||
| Original text written by user: | ||||||||||||||||||||||||||||||||||||||||||||||||
| IsPrivate? | No (this computation is public) | |||||||||||||||||||||||||||||||||||||||||||||||
| User-defined keywords | ||||||||||||||||||||||||||||||||||||||||||||||||
| Estimated Impact | 96 | |||||||||||||||||||||||||||||||||||||||||||||||
Tree of Dependent Computations | ||||||||||||||||||||||||||||||||||||||||||||||||
| Family? (F = Feedback message, R = changed R code, M = changed R Module, P = changed Parameters, D = changed Data) | ||||||||||||||||||||||||||||||||||||||||||||||||
| - [ML Fitting and QQ Plot- Normal Distribution] [ML fitting - norm...] [2017-11-29 13:11:40] [daf9a8d262d38e2e737ec3f2901e85ae] [Current] | ||||||||||||||||||||||||||||||||||||||||||||||||
| Feedback Forum | ||||||||||||||||||||||||||||||||||||||||||||||||
Post a new message | ||||||||||||||||||||||||||||||||||||||||||||||||
Dataset | ||||||||||||||||||||||||||||||||||||||||||||||||
| Dataseries X: | ||||||||||||||||||||||||||||||||||||||||||||||||
8485 1500000 103833 15000 9964 10000 15000 18896 5000 30657 20335 3105 34965 7400 17232 13681 16000 10879 36000 434084 33837 12101 11242 90215 228 14034 37700 18491 12913 100000 3500 600 17859 50 52000 31730 7551 0 17000 12000 52000 0 1126 39466 21000 27368 20200 50000 18450 9520 8241 101647 37782 25109 46500 16112 80000 526269 70745 20516 400 24000 20000 70000 3084506 9206 10882 29828 1000 18269 32031 68770 12759 10659 7495 19951 2056743 73467 16000 10393 2662 0 0 25986 6541 0 9964 6971 6986 5000 9501 3152 23009 68120 9841 10000 41214 2000 10000 28467 12545 12500 2188 25000 250 5256 37000 18013 2803 28074 637957 12804 10000 27607 337 15869 4123 85291 16340 9133 0 14634 0 10000 3030 9695 4000 2960 54938 634746 7164 100 1451529 55000 23747 4200 127800 53779 9573 16897 15463 13650 20833 22376 26253 107441 16725 66711 517 13986 18352 70000 1100 59343 14548 7214 78780 20400 11492 2998 37240 8240 11322 716360 26059 9666 10000 33100 24573 4700 50400 25217 22692 1921 33000 5000 80000 2000 46297 9964 4435 104600 9950 30000 15000 179895 14164 6620 15000 25150 8537 50 14768 21507 68350 13671 26771 | ||||||||||||||||||||||||||||||||||||||||||||||||
Tables (Output of Computation) | ||||||||||||||||||||||||||||||||||||||||||||||||
| ||||||||||||||||||||||||||||||||||||||||||||||||
Figures (Output of Computation) | ||||||||||||||||||||||||||||||||||||||||||||||||
Input Parameters & R Code | ||||||||||||||||||||||||||||||||||||||||||||||||
| Parameters (Session): | ||||||||||||||||||||||||||||||||||||||||||||||||
| par1 = 0.01 ; par2 = 0.99 ; par3 = 0.01 ; | ||||||||||||||||||||||||||||||||||||||||||||||||
| Parameters (R input): | ||||||||||||||||||||||||||||||||||||||||||||||||
| par1 = 8 ; par2 = 0 ; | ||||||||||||||||||||||||||||||||||||||||||||||||
| R code (references can be found in the software module): | ||||||||||||||||||||||||||||||||||||||||||||||||
library(MASS) | ||||||||||||||||||||||||||||||||||||||||||||||||