Free Statistics

of Irreproducible Research!

Author's title

Author*Unverified author*
R Software Modulerwasp_autocorrelation.wasp
Title produced by software(Partial) Autocorrelation Function
Date of computationThu, 16 Nov 2017 12:51:44 +0100
Cite this page as followsStatistical Computations at FreeStatistics.org, Office for Research Development and Education, URL https://freestatistics.org/blog/index.php?v=date/2017/Nov/16/t1510833130sdmvwo5iliuj8ti.htm/, Retrieved Sat, 18 May 2024 11:12:56 +0000
Statistical Computations at FreeStatistics.org, Office for Research Development and Education, URL https://freestatistics.org/blog/index.php?pk=308105, Retrieved Sat, 18 May 2024 11:12:56 +0000
QR Codes:

Original text written by user:
IsPrivate?No (this computation is public)
User-defined keywords
Estimated Impact121
Family? (F = Feedback message, R = changed R code, M = changed R Module, P = changed Parameters, D = changed Data)
-       [(Partial) Autocorrelation Function] [] [2017-11-16 11:51:44] [8dbf41c7cbdb157290d3553a01efa020] [Current]
Feedback Forum

Post a new message
Dataseries X:
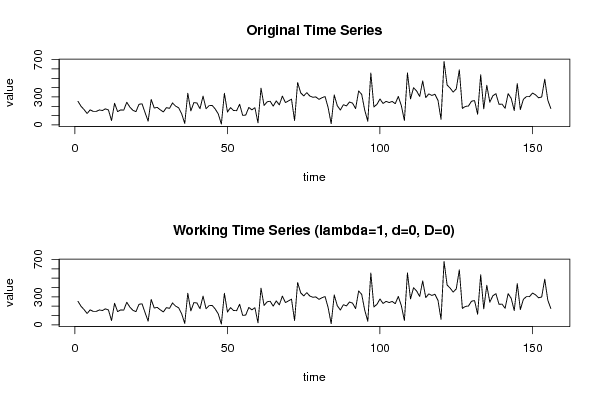
254
200
165
123
162
145
145
161
155
173
160
47
232
143
161
159
243
192
157
143
221
227
132
41
273
182
188
162
140
186
178
236
202
184
119
16
340
151
240
235
174
309
174
207
209
171
117
10
339
139
186
155
153
222
102
107
188
162
185
24
394
209
248
254
202
258
215
309
240
258
276
48
455
345
311
346
310
297
300
274
292
304
186
14
321
206
160
217
204
246
234
175
364
328
158
40
556
193
221
278
230
253
240
252
228
306
206
48
557
279
399
364
306
471
293
333
316
329
265
61
679
428
394
352
387
590
177
199
203
255
261
115
537
172
425
244
313
335
222
223
179
335
286
154
443
165
275
304
303
342
322
291
300
491
266
176


Summary of computational transaction
Raw Input view raw input (R code)
Raw Outputview raw output of R engine
Computing time1 seconds
R ServerBig Analytics Cloud Computing Center

\begin{tabular}{lllllllll}
\hline
Summary of computational transaction \tabularnewline
Raw Input view raw input (R code)  \tabularnewline
Raw Outputview raw output of R engine  \tabularnewline
Computing time1 seconds \tabularnewline
R ServerBig Analytics Cloud Computing Center \tabularnewline
\hline
\end{tabular}
%Source: https://freestatistics.org/blog/index.php?pk=308105&T=0

[TABLE]
[ROW]
Summary of computational transaction[/C][/ROW] [ROW]Raw Input[/C] view raw input (R code) [/C][/ROW] [ROW]Raw Output[/C]view raw output of R engine [/C][/ROW] [ROW]Computing time[/C]1 seconds[/C][/ROW] [ROW]R Server[/C]Big Analytics Cloud Computing Center[/C][/ROW] [/TABLE] Source: https://freestatistics.org/blog/index.php?pk=308105&T=0

Globally Unique Identifier (entire table): ba.freestatistics.org/blog/index.php?pk=308105&T=0

As an alternative you can also use a QR Code:  

The GUIDs for individual cells are displayed in the table below:

Summary of computational transaction
Raw Input view raw input (R code)
Raw Outputview raw output of R engine
Computing time1 seconds
R ServerBig Analytics Cloud Computing Center


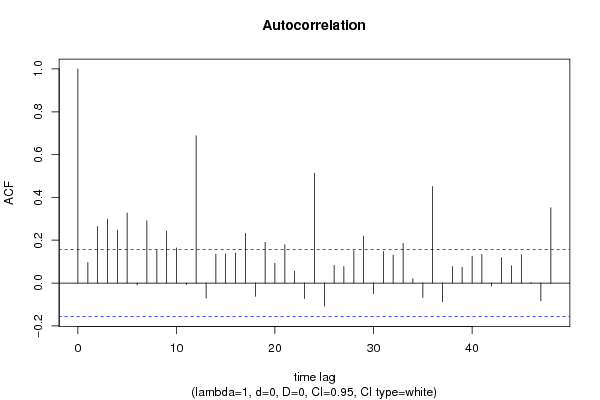
Autocorrelation Function
Time lag kACF(k)T-STATP-value
10.0957671.19610.11673
20.2634973.29110.000617
30.2977373.71870.000139
40.2465373.07920.001226
50.327074.08513.5e-05
6-0.009212-0.11510.454273
70.2911563.63650.000187
80.1532851.91450.028691
90.2432043.03760.001398
100.1637082.04470.021282
11-0.008348-0.10430.458546
120.6875138.5870
13-0.069596-0.86930.193022
140.1349221.68520.046977
150.1356211.69390.046139
160.1404861.75470.04064
170.2330232.91050.002069
18-0.061452-0.76750.221963
190.189942.37230.009447
200.0923361.15330.12528
210.1786652.23150.013536
220.0559220.69850.242962
23-0.072303-0.90310.183944
240.5130136.40750
25-0.107451-1.34210.090764
260.0822241.0270.153011
270.0766010.95670.170089
280.1512931.88960.03033
290.2191182.73680.003462
30-0.049401-0.6170.269061
310.147251.83910.033897
320.1305761.63090.052465
330.1848812.30920.011123
340.0195870.24460.403528
35-0.067128-0.83840.201536
360.4511615.6350
37-0.087567-1.09370.137884
380.0766980.9580.169783
390.0737310.92090.179264
400.1249941.56120.060254
410.133691.66980.048484
42-0.013503-0.16870.433145
430.1186731.48220.070149
440.0802751.00260.158796
450.132071.64960.050523
460.0010390.0130.494829
47-0.082639-1.03220.151798
480.3520064.39661e-05

\begin{tabular}{lllllllll}
\hline
Autocorrelation Function \tabularnewline
Time lag k & ACF(k) & T-STAT & P-value \tabularnewline
1 & 0.095767 & 1.1961 & 0.11673 \tabularnewline
2 & 0.263497 & 3.2911 & 0.000617 \tabularnewline
3 & 0.297737 & 3.7187 & 0.000139 \tabularnewline
4 & 0.246537 & 3.0792 & 0.001226 \tabularnewline
5 & 0.32707 & 4.0851 & 3.5e-05 \tabularnewline
6 & -0.009212 & -0.1151 & 0.454273 \tabularnewline
7 & 0.291156 & 3.6365 & 0.000187 \tabularnewline
8 & 0.153285 & 1.9145 & 0.028691 \tabularnewline
9 & 0.243204 & 3.0376 & 0.001398 \tabularnewline
10 & 0.163708 & 2.0447 & 0.021282 \tabularnewline
11 & -0.008348 & -0.1043 & 0.458546 \tabularnewline
12 & 0.687513 & 8.587 & 0 \tabularnewline
13 & -0.069596 & -0.8693 & 0.193022 \tabularnewline
14 & 0.134922 & 1.6852 & 0.046977 \tabularnewline
15 & 0.135621 & 1.6939 & 0.046139 \tabularnewline
16 & 0.140486 & 1.7547 & 0.04064 \tabularnewline
17 & 0.233023 & 2.9105 & 0.002069 \tabularnewline
18 & -0.061452 & -0.7675 & 0.221963 \tabularnewline
19 & 0.18994 & 2.3723 & 0.009447 \tabularnewline
20 & 0.092336 & 1.1533 & 0.12528 \tabularnewline
21 & 0.178665 & 2.2315 & 0.013536 \tabularnewline
22 & 0.055922 & 0.6985 & 0.242962 \tabularnewline
23 & -0.072303 & -0.9031 & 0.183944 \tabularnewline
24 & 0.513013 & 6.4075 & 0 \tabularnewline
25 & -0.107451 & -1.3421 & 0.090764 \tabularnewline
26 & 0.082224 & 1.027 & 0.153011 \tabularnewline
27 & 0.076601 & 0.9567 & 0.170089 \tabularnewline
28 & 0.151293 & 1.8896 & 0.03033 \tabularnewline
29 & 0.219118 & 2.7368 & 0.003462 \tabularnewline
30 & -0.049401 & -0.617 & 0.269061 \tabularnewline
31 & 0.14725 & 1.8391 & 0.033897 \tabularnewline
32 & 0.130576 & 1.6309 & 0.052465 \tabularnewline
33 & 0.184881 & 2.3092 & 0.011123 \tabularnewline
34 & 0.019587 & 0.2446 & 0.403528 \tabularnewline
35 & -0.067128 & -0.8384 & 0.201536 \tabularnewline
36 & 0.451161 & 5.635 & 0 \tabularnewline
37 & -0.087567 & -1.0937 & 0.137884 \tabularnewline
38 & 0.076698 & 0.958 & 0.169783 \tabularnewline
39 & 0.073731 & 0.9209 & 0.179264 \tabularnewline
40 & 0.124994 & 1.5612 & 0.060254 \tabularnewline
41 & 0.13369 & 1.6698 & 0.048484 \tabularnewline
42 & -0.013503 & -0.1687 & 0.433145 \tabularnewline
43 & 0.118673 & 1.4822 & 0.070149 \tabularnewline
44 & 0.080275 & 1.0026 & 0.158796 \tabularnewline
45 & 0.13207 & 1.6496 & 0.050523 \tabularnewline
46 & 0.001039 & 0.013 & 0.494829 \tabularnewline
47 & -0.082639 & -1.0322 & 0.151798 \tabularnewline
48 & 0.352006 & 4.3966 & 1e-05 \tabularnewline
\hline
\end{tabular}
%Source: https://freestatistics.org/blog/index.php?pk=308105&T=1

[TABLE]
[ROW][C]Autocorrelation Function[/C][/ROW]
[ROW][C]Time lag k[/C][C]ACF(k)[/C][C]T-STAT[/C][C]P-value[/C][/ROW]
[ROW][C]1[/C][C]0.095767[/C][C]1.1961[/C][C]0.11673[/C][/ROW]
[ROW][C]2[/C][C]0.263497[/C][C]3.2911[/C][C]0.000617[/C][/ROW]
[ROW][C]3[/C][C]0.297737[/C][C]3.7187[/C][C]0.000139[/C][/ROW]
[ROW][C]4[/C][C]0.246537[/C][C]3.0792[/C][C]0.001226[/C][/ROW]
[ROW][C]5[/C][C]0.32707[/C][C]4.0851[/C][C]3.5e-05[/C][/ROW]
[ROW][C]6[/C][C]-0.009212[/C][C]-0.1151[/C][C]0.454273[/C][/ROW]
[ROW][C]7[/C][C]0.291156[/C][C]3.6365[/C][C]0.000187[/C][/ROW]
[ROW][C]8[/C][C]0.153285[/C][C]1.9145[/C][C]0.028691[/C][/ROW]
[ROW][C]9[/C][C]0.243204[/C][C]3.0376[/C][C]0.001398[/C][/ROW]
[ROW][C]10[/C][C]0.163708[/C][C]2.0447[/C][C]0.021282[/C][/ROW]
[ROW][C]11[/C][C]-0.008348[/C][C]-0.1043[/C][C]0.458546[/C][/ROW]
[ROW][C]12[/C][C]0.687513[/C][C]8.587[/C][C]0[/C][/ROW]
[ROW][C]13[/C][C]-0.069596[/C][C]-0.8693[/C][C]0.193022[/C][/ROW]
[ROW][C]14[/C][C]0.134922[/C][C]1.6852[/C][C]0.046977[/C][/ROW]
[ROW][C]15[/C][C]0.135621[/C][C]1.6939[/C][C]0.046139[/C][/ROW]
[ROW][C]16[/C][C]0.140486[/C][C]1.7547[/C][C]0.04064[/C][/ROW]
[ROW][C]17[/C][C]0.233023[/C][C]2.9105[/C][C]0.002069[/C][/ROW]
[ROW][C]18[/C][C]-0.061452[/C][C]-0.7675[/C][C]0.221963[/C][/ROW]
[ROW][C]19[/C][C]0.18994[/C][C]2.3723[/C][C]0.009447[/C][/ROW]
[ROW][C]20[/C][C]0.092336[/C][C]1.1533[/C][C]0.12528[/C][/ROW]
[ROW][C]21[/C][C]0.178665[/C][C]2.2315[/C][C]0.013536[/C][/ROW]
[ROW][C]22[/C][C]0.055922[/C][C]0.6985[/C][C]0.242962[/C][/ROW]
[ROW][C]23[/C][C]-0.072303[/C][C]-0.9031[/C][C]0.183944[/C][/ROW]
[ROW][C]24[/C][C]0.513013[/C][C]6.4075[/C][C]0[/C][/ROW]
[ROW][C]25[/C][C]-0.107451[/C][C]-1.3421[/C][C]0.090764[/C][/ROW]
[ROW][C]26[/C][C]0.082224[/C][C]1.027[/C][C]0.153011[/C][/ROW]
[ROW][C]27[/C][C]0.076601[/C][C]0.9567[/C][C]0.170089[/C][/ROW]
[ROW][C]28[/C][C]0.151293[/C][C]1.8896[/C][C]0.03033[/C][/ROW]
[ROW][C]29[/C][C]0.219118[/C][C]2.7368[/C][C]0.003462[/C][/ROW]
[ROW][C]30[/C][C]-0.049401[/C][C]-0.617[/C][C]0.269061[/C][/ROW]
[ROW][C]31[/C][C]0.14725[/C][C]1.8391[/C][C]0.033897[/C][/ROW]
[ROW][C]32[/C][C]0.130576[/C][C]1.6309[/C][C]0.052465[/C][/ROW]
[ROW][C]33[/C][C]0.184881[/C][C]2.3092[/C][C]0.011123[/C][/ROW]
[ROW][C]34[/C][C]0.019587[/C][C]0.2446[/C][C]0.403528[/C][/ROW]
[ROW][C]35[/C][C]-0.067128[/C][C]-0.8384[/C][C]0.201536[/C][/ROW]
[ROW][C]36[/C][C]0.451161[/C][C]5.635[/C][C]0[/C][/ROW]
[ROW][C]37[/C][C]-0.087567[/C][C]-1.0937[/C][C]0.137884[/C][/ROW]
[ROW][C]38[/C][C]0.076698[/C][C]0.958[/C][C]0.169783[/C][/ROW]
[ROW][C]39[/C][C]0.073731[/C][C]0.9209[/C][C]0.179264[/C][/ROW]
[ROW][C]40[/C][C]0.124994[/C][C]1.5612[/C][C]0.060254[/C][/ROW]
[ROW][C]41[/C][C]0.13369[/C][C]1.6698[/C][C]0.048484[/C][/ROW]
[ROW][C]42[/C][C]-0.013503[/C][C]-0.1687[/C][C]0.433145[/C][/ROW]
[ROW][C]43[/C][C]0.118673[/C][C]1.4822[/C][C]0.070149[/C][/ROW]
[ROW][C]44[/C][C]0.080275[/C][C]1.0026[/C][C]0.158796[/C][/ROW]
[ROW][C]45[/C][C]0.13207[/C][C]1.6496[/C][C]0.050523[/C][/ROW]
[ROW][C]46[/C][C]0.001039[/C][C]0.013[/C][C]0.494829[/C][/ROW]
[ROW][C]47[/C][C]-0.082639[/C][C]-1.0322[/C][C]0.151798[/C][/ROW]
[ROW][C]48[/C][C]0.352006[/C][C]4.3966[/C][C]1e-05[/C][/ROW]
[/TABLE]
Source: https://freestatistics.org/blog/index.php?pk=308105&T=1

Globally Unique Identifier (entire table): ba.freestatistics.org/blog/index.php?pk=308105&T=1

As an alternative you can also use a QR Code:  

The GUIDs for individual cells are displayed in the table below:

Autocorrelation Function
Time lag kACF(k)T-STATP-value
10.0957671.19610.11673
20.2634973.29110.000617
30.2977373.71870.000139
40.2465373.07920.001226
50.327074.08513.5e-05
6-0.009212-0.11510.454273
70.2911563.63650.000187
80.1532851.91450.028691
90.2432043.03760.001398
100.1637082.04470.021282
11-0.008348-0.10430.458546
120.6875138.5870
13-0.069596-0.86930.193022
140.1349221.68520.046977
150.1356211.69390.046139
160.1404861.75470.04064
170.2330232.91050.002069
18-0.061452-0.76750.221963
190.189942.37230.009447
200.0923361.15330.12528
210.1786652.23150.013536
220.0559220.69850.242962
23-0.072303-0.90310.183944
240.5130136.40750
25-0.107451-1.34210.090764
260.0822241.0270.153011
270.0766010.95670.170089
280.1512931.88960.03033
290.2191182.73680.003462
30-0.049401-0.6170.269061
310.147251.83910.033897
320.1305761.63090.052465
330.1848812.30920.011123
340.0195870.24460.403528
35-0.067128-0.83840.201536
360.4511615.6350
37-0.087567-1.09370.137884
380.0766980.9580.169783
390.0737310.92090.179264
400.1249941.56120.060254
410.133691.66980.048484
42-0.013503-0.16870.433145
430.1186731.48220.070149
440.0802751.00260.158796
450.132071.64960.050523
460.0010390.0130.494829
47-0.082639-1.03220.151798
480.3520064.39661e-05


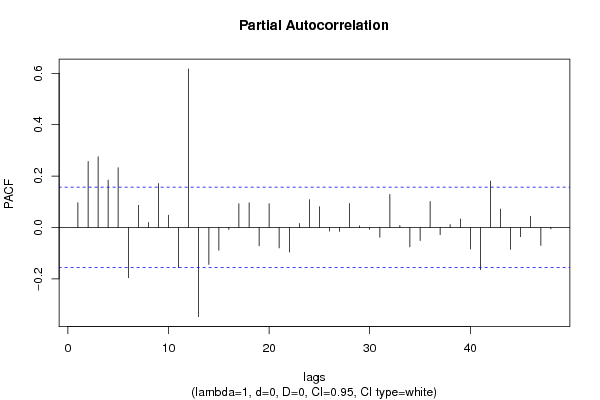
Partial Autocorrelation Function
Time lag kPACF(k)T-STATP-value
10.0957671.19610.11673
20.256683.20590.000817
30.2748623.4330.000382
40.1841312.29980.011393
50.2319872.89750.002151
6-0.195754-2.4450.0078
70.0858391.07210.142659
80.0188390.23530.407145
90.1712262.13860.017012
100.0476530.59520.276289
11-0.156598-1.95590.026131
120.6167617.70330
13-0.347346-4.33831.3e-05
14-0.143979-1.79830.037032
15-0.088377-1.10380.135685
16-0.007842-0.0980.461048
170.092471.1550.124938
180.0954951.19270.117392
19-0.071381-0.89150.187005
200.0924621.15480.124959
21-0.07981-0.99680.160195
22-0.095789-1.19640.116677
230.0153430.19160.424138
240.1079241.3480.08981
250.0802321.00210.158925
26-0.014193-0.17730.429763
27-0.015524-0.19390.423255
280.0931291.16320.123266
290.0061210.07640.469581
30-0.007321-0.09140.463631
31-0.038237-0.47760.316808
320.1282581.60190.055596
330.0073590.09190.463442
34-0.07566-0.9450.173061
35-0.050759-0.6340.263511
360.1010331.26190.104433
37-0.028099-0.3510.363047
380.0108870.1360.446006
390.0326530.40780.341978
40-0.084218-1.05190.147241
41-0.164377-2.05310.020868
420.1800792.24920.01295
430.0712230.88960.187533
44-0.085442-1.06720.143771
45-0.035809-0.44720.327658
460.0438030.54710.292548
47-0.069884-0.87280.192044
48-0.005814-0.07260.471104

\begin{tabular}{lllllllll}
\hline
Partial Autocorrelation Function \tabularnewline
Time lag k & PACF(k) & T-STAT & P-value \tabularnewline
1 & 0.095767 & 1.1961 & 0.11673 \tabularnewline
2 & 0.25668 & 3.2059 & 0.000817 \tabularnewline
3 & 0.274862 & 3.433 & 0.000382 \tabularnewline
4 & 0.184131 & 2.2998 & 0.011393 \tabularnewline
5 & 0.231987 & 2.8975 & 0.002151 \tabularnewline
6 & -0.195754 & -2.445 & 0.0078 \tabularnewline
7 & 0.085839 & 1.0721 & 0.142659 \tabularnewline
8 & 0.018839 & 0.2353 & 0.407145 \tabularnewline
9 & 0.171226 & 2.1386 & 0.017012 \tabularnewline
10 & 0.047653 & 0.5952 & 0.276289 \tabularnewline
11 & -0.156598 & -1.9559 & 0.026131 \tabularnewline
12 & 0.616761 & 7.7033 & 0 \tabularnewline
13 & -0.347346 & -4.3383 & 1.3e-05 \tabularnewline
14 & -0.143979 & -1.7983 & 0.037032 \tabularnewline
15 & -0.088377 & -1.1038 & 0.135685 \tabularnewline
16 & -0.007842 & -0.098 & 0.461048 \tabularnewline
17 & 0.09247 & 1.155 & 0.124938 \tabularnewline
18 & 0.095495 & 1.1927 & 0.117392 \tabularnewline
19 & -0.071381 & -0.8915 & 0.187005 \tabularnewline
20 & 0.092462 & 1.1548 & 0.124959 \tabularnewline
21 & -0.07981 & -0.9968 & 0.160195 \tabularnewline
22 & -0.095789 & -1.1964 & 0.116677 \tabularnewline
23 & 0.015343 & 0.1916 & 0.424138 \tabularnewline
24 & 0.107924 & 1.348 & 0.08981 \tabularnewline
25 & 0.080232 & 1.0021 & 0.158925 \tabularnewline
26 & -0.014193 & -0.1773 & 0.429763 \tabularnewline
27 & -0.015524 & -0.1939 & 0.423255 \tabularnewline
28 & 0.093129 & 1.1632 & 0.123266 \tabularnewline
29 & 0.006121 & 0.0764 & 0.469581 \tabularnewline
30 & -0.007321 & -0.0914 & 0.463631 \tabularnewline
31 & -0.038237 & -0.4776 & 0.316808 \tabularnewline
32 & 0.128258 & 1.6019 & 0.055596 \tabularnewline
33 & 0.007359 & 0.0919 & 0.463442 \tabularnewline
34 & -0.07566 & -0.945 & 0.173061 \tabularnewline
35 & -0.050759 & -0.634 & 0.263511 \tabularnewline
36 & 0.101033 & 1.2619 & 0.104433 \tabularnewline
37 & -0.028099 & -0.351 & 0.363047 \tabularnewline
38 & 0.010887 & 0.136 & 0.446006 \tabularnewline
39 & 0.032653 & 0.4078 & 0.341978 \tabularnewline
40 & -0.084218 & -1.0519 & 0.147241 \tabularnewline
41 & -0.164377 & -2.0531 & 0.020868 \tabularnewline
42 & 0.180079 & 2.2492 & 0.01295 \tabularnewline
43 & 0.071223 & 0.8896 & 0.187533 \tabularnewline
44 & -0.085442 & -1.0672 & 0.143771 \tabularnewline
45 & -0.035809 & -0.4472 & 0.327658 \tabularnewline
46 & 0.043803 & 0.5471 & 0.292548 \tabularnewline
47 & -0.069884 & -0.8728 & 0.192044 \tabularnewline
48 & -0.005814 & -0.0726 & 0.471104 \tabularnewline
\hline
\end{tabular}
%Source: https://freestatistics.org/blog/index.php?pk=308105&T=2

[TABLE]
[ROW][C]Partial Autocorrelation Function[/C][/ROW]
[ROW][C]Time lag k[/C][C]PACF(k)[/C][C]T-STAT[/C][C]P-value[/C][/ROW]
[ROW][C]1[/C][C]0.095767[/C][C]1.1961[/C][C]0.11673[/C][/ROW]
[ROW][C]2[/C][C]0.25668[/C][C]3.2059[/C][C]0.000817[/C][/ROW]
[ROW][C]3[/C][C]0.274862[/C][C]3.433[/C][C]0.000382[/C][/ROW]
[ROW][C]4[/C][C]0.184131[/C][C]2.2998[/C][C]0.011393[/C][/ROW]
[ROW][C]5[/C][C]0.231987[/C][C]2.8975[/C][C]0.002151[/C][/ROW]
[ROW][C]6[/C][C]-0.195754[/C][C]-2.445[/C][C]0.0078[/C][/ROW]
[ROW][C]7[/C][C]0.085839[/C][C]1.0721[/C][C]0.142659[/C][/ROW]
[ROW][C]8[/C][C]0.018839[/C][C]0.2353[/C][C]0.407145[/C][/ROW]
[ROW][C]9[/C][C]0.171226[/C][C]2.1386[/C][C]0.017012[/C][/ROW]
[ROW][C]10[/C][C]0.047653[/C][C]0.5952[/C][C]0.276289[/C][/ROW]
[ROW][C]11[/C][C]-0.156598[/C][C]-1.9559[/C][C]0.026131[/C][/ROW]
[ROW][C]12[/C][C]0.616761[/C][C]7.7033[/C][C]0[/C][/ROW]
[ROW][C]13[/C][C]-0.347346[/C][C]-4.3383[/C][C]1.3e-05[/C][/ROW]
[ROW][C]14[/C][C]-0.143979[/C][C]-1.7983[/C][C]0.037032[/C][/ROW]
[ROW][C]15[/C][C]-0.088377[/C][C]-1.1038[/C][C]0.135685[/C][/ROW]
[ROW][C]16[/C][C]-0.007842[/C][C]-0.098[/C][C]0.461048[/C][/ROW]
[ROW][C]17[/C][C]0.09247[/C][C]1.155[/C][C]0.124938[/C][/ROW]
[ROW][C]18[/C][C]0.095495[/C][C]1.1927[/C][C]0.117392[/C][/ROW]
[ROW][C]19[/C][C]-0.071381[/C][C]-0.8915[/C][C]0.187005[/C][/ROW]
[ROW][C]20[/C][C]0.092462[/C][C]1.1548[/C][C]0.124959[/C][/ROW]
[ROW][C]21[/C][C]-0.07981[/C][C]-0.9968[/C][C]0.160195[/C][/ROW]
[ROW][C]22[/C][C]-0.095789[/C][C]-1.1964[/C][C]0.116677[/C][/ROW]
[ROW][C]23[/C][C]0.015343[/C][C]0.1916[/C][C]0.424138[/C][/ROW]
[ROW][C]24[/C][C]0.107924[/C][C]1.348[/C][C]0.08981[/C][/ROW]
[ROW][C]25[/C][C]0.080232[/C][C]1.0021[/C][C]0.158925[/C][/ROW]
[ROW][C]26[/C][C]-0.014193[/C][C]-0.1773[/C][C]0.429763[/C][/ROW]
[ROW][C]27[/C][C]-0.015524[/C][C]-0.1939[/C][C]0.423255[/C][/ROW]
[ROW][C]28[/C][C]0.093129[/C][C]1.1632[/C][C]0.123266[/C][/ROW]
[ROW][C]29[/C][C]0.006121[/C][C]0.0764[/C][C]0.469581[/C][/ROW]
[ROW][C]30[/C][C]-0.007321[/C][C]-0.0914[/C][C]0.463631[/C][/ROW]
[ROW][C]31[/C][C]-0.038237[/C][C]-0.4776[/C][C]0.316808[/C][/ROW]
[ROW][C]32[/C][C]0.128258[/C][C]1.6019[/C][C]0.055596[/C][/ROW]
[ROW][C]33[/C][C]0.007359[/C][C]0.0919[/C][C]0.463442[/C][/ROW]
[ROW][C]34[/C][C]-0.07566[/C][C]-0.945[/C][C]0.173061[/C][/ROW]
[ROW][C]35[/C][C]-0.050759[/C][C]-0.634[/C][C]0.263511[/C][/ROW]
[ROW][C]36[/C][C]0.101033[/C][C]1.2619[/C][C]0.104433[/C][/ROW]
[ROW][C]37[/C][C]-0.028099[/C][C]-0.351[/C][C]0.363047[/C][/ROW]
[ROW][C]38[/C][C]0.010887[/C][C]0.136[/C][C]0.446006[/C][/ROW]
[ROW][C]39[/C][C]0.032653[/C][C]0.4078[/C][C]0.341978[/C][/ROW]
[ROW][C]40[/C][C]-0.084218[/C][C]-1.0519[/C][C]0.147241[/C][/ROW]
[ROW][C]41[/C][C]-0.164377[/C][C]-2.0531[/C][C]0.020868[/C][/ROW]
[ROW][C]42[/C][C]0.180079[/C][C]2.2492[/C][C]0.01295[/C][/ROW]
[ROW][C]43[/C][C]0.071223[/C][C]0.8896[/C][C]0.187533[/C][/ROW]
[ROW][C]44[/C][C]-0.085442[/C][C]-1.0672[/C][C]0.143771[/C][/ROW]
[ROW][C]45[/C][C]-0.035809[/C][C]-0.4472[/C][C]0.327658[/C][/ROW]
[ROW][C]46[/C][C]0.043803[/C][C]0.5471[/C][C]0.292548[/C][/ROW]
[ROW][C]47[/C][C]-0.069884[/C][C]-0.8728[/C][C]0.192044[/C][/ROW]
[ROW][C]48[/C][C]-0.005814[/C][C]-0.0726[/C][C]0.471104[/C][/ROW]
[/TABLE]
Source: https://freestatistics.org/blog/index.php?pk=308105&T=2

Globally Unique Identifier (entire table): ba.freestatistics.org/blog/index.php?pk=308105&T=2

As an alternative you can also use a QR Code:  

The GUIDs for individual cells are displayed in the table below:

Partial Autocorrelation Function
Time lag kPACF(k)T-STATP-value
10.0957671.19610.11673
20.256683.20590.000817
30.2748623.4330.000382
40.1841312.29980.011393
50.2319872.89750.002151
6-0.195754-2.4450.0078
70.0858391.07210.142659
80.0188390.23530.407145
90.1712262.13860.017012
100.0476530.59520.276289
11-0.156598-1.95590.026131
120.6167617.70330
13-0.347346-4.33831.3e-05
14-0.143979-1.79830.037032
15-0.088377-1.10380.135685
16-0.007842-0.0980.461048
170.092471.1550.124938
180.0954951.19270.117392
19-0.071381-0.89150.187005
200.0924621.15480.124959
21-0.07981-0.99680.160195
22-0.095789-1.19640.116677
230.0153430.19160.424138
240.1079241.3480.08981
250.0802321.00210.158925
26-0.014193-0.17730.429763
27-0.015524-0.19390.423255
280.0931291.16320.123266
290.0061210.07640.469581
30-0.007321-0.09140.463631
31-0.038237-0.47760.316808
320.1282581.60190.055596
330.0073590.09190.463442
34-0.07566-0.9450.173061
35-0.050759-0.6340.263511
360.1010331.26190.104433
37-0.028099-0.3510.363047
380.0108870.1360.446006
390.0326530.40780.341978
40-0.084218-1.05190.147241
41-0.164377-2.05310.020868
420.1800792.24920.01295
430.0712230.88960.187533
44-0.085442-1.06720.143771
45-0.035809-0.44720.327658
460.0438030.54710.292548
47-0.069884-0.87280.192044
48-0.005814-0.07260.471104


Parameters (Session):
par1 = 48 ; par2 = 1 ; par3 = 0 ; par4 = 0 ; par5 = 12 ; par6 = White Noise ; par7 = 0.95 ;
Parameters (R input):
par1 = 48 ; par2 = 1 ; par3 = 0 ; par4 = 0 ; par5 = 12 ; par6 = White Noise ; par7 = 0.95 ; par8 = ;
R code (references can be found in the software module):
if (par1 == 'Default') {
par1 = 10*log10(length(x))
} else {
par1 <- as.numeric(par1)
}
par2 <- as.numeric(par2)
par3 <- as.numeric(par3)
par4 <- as.numeric(par4)
par5 <- as.numeric(par5)
if (par6 == 'White Noise') par6 <- 'white' else par6 <- 'ma'
par7 <- as.numeric(par7)
if (par8 != '') par8 <- as.numeric(par8)
x <- na.omit(x)
ox <- x
if (par8 == '') {
if (par2 == 0) {
x <- log(x)
} else {
x <- (x ^ par2 - 1) / par2
}
} else {
x <- log(x,base=par8)
}
if (par3 > 0) x <- diff(x,lag=1,difference=par3)
if (par4 > 0) x <- diff(x,lag=par5,difference=par4)
bitmap(file='picts.png')
op <- par(mfrow=c(2,1))
plot(ox,type='l',main='Original Time Series',xlab='time',ylab='value')
if (par8=='') {
mytitle <- paste('Working Time Series (lambda=',par2,', d=',par3,', D=',par4,')',sep='')
mysub <- paste('(lambda=',par2,', d=',par3,', D=',par4,', CI=', par7, ', CI type=',par6,')',sep='')
} else {
mytitle <- paste('Working Time Series (base=',par8,', d=',par3,', D=',par4,')',sep='')
mysub <- paste('(base=',par8,', d=',par3,', D=',par4,', CI=', par7, ', CI type=',par6,')',sep='')
}
plot(x,type='l', main=mytitle,xlab='time',ylab='value')
par(op)
dev.off()
bitmap(file='pic1.png')
racf <- acf(x, par1, main='Autocorrelation', xlab='time lag', ylab='ACF', ci.type=par6, ci=par7, sub=mysub)
dev.off()
bitmap(file='pic2.png')
rpacf <- pacf(x,par1,main='Partial Autocorrelation',xlab='lags',ylab='PACF',sub=mysub)
dev.off()
(myacf <- c(racf$acf))
(mypacf <- c(rpacf$acf))
lengthx <- length(x)
sqrtn <- sqrt(lengthx)
load(file='createtable')
a<-table.start()
a<-table.row.start(a)
a<-table.element(a,'Autocorrelation Function',4,TRUE)
a<-table.row.end(a)
a<-table.row.start(a)
a<-table.element(a,'Time lag k',header=TRUE)
a<-table.element(a,'ACF(k)',header=TRUE)
a<-table.element(a,'T-STAT',header=TRUE)
a<-table.element(a,'P-value',header=TRUE)
a<-table.row.end(a)
for (i in 2:(par1+1)) {
a<-table.row.start(a)
a<-table.element(a,i-1,header=TRUE)
a<-table.element(a,round(myacf[i],6))
mytstat <- myacf[i]*sqrtn
a<-table.element(a,round(mytstat,4))
a<-table.element(a,round(1-pt(abs(mytstat),lengthx),6))
a<-table.row.end(a)
}
a<-table.end(a)
table.save(a,file='mytable.tab')
a<-table.start()
a<-table.row.start(a)
a<-table.element(a,'Partial Autocorrelation Function',4,TRUE)
a<-table.row.end(a)
a<-table.row.start(a)
a<-table.element(a,'Time lag k',header=TRUE)
a<-table.element(a,'PACF(k)',header=TRUE)
a<-table.element(a,'T-STAT',header=TRUE)
a<-table.element(a,'P-value',header=TRUE)
a<-table.row.end(a)
for (i in 1:par1) {
a<-table.row.start(a)
a<-table.element(a,i,header=TRUE)
a<-table.element(a,round(mypacf[i],6))
mytstat <- mypacf[i]*sqrtn
a<-table.element(a,round(mytstat,4))
a<-table.element(a,round(1-pt(abs(mytstat),lengthx),6))
a<-table.row.end(a)
}
a<-table.end(a)
table.save(a,file='mytable1.tab')