Free Statistics

of Irreproducible Research!

Author's title

Author*Unverified author*
R Software Modulerwasp_exponentialsmoothing.wasp
Title produced by softwareExponential Smoothing
Date of computationFri, 19 May 2017 08:34:18 +0100
Cite this page as followsStatistical Computations at FreeStatistics.org, Office for Research Development and Education, URL https://freestatistics.org/blog/index.php?v=date/2017/May/19/t1495179285nokn2r2ibvcstx7.htm/, Retrieved Wed, 15 May 2024 21:21:43 +0200
Statistical Computations at FreeStatistics.org, Office for Research Development and Education, URL https://freestatistics.org/blog/index.php?pk=, Retrieved Wed, 15 May 2024 21:21:43 +0200
QR Codes:

Original text written by user:
IsPrivate?No (this computation is public)
User-defined keywords
Estimated Impact0
Dataseries X:
92.81
92.82
92.82
92.88
93.38
93.89
94.1
94.18
94.3
94.31
94.36
94.38
94.38
94.5
94.57
94.89
96.71
97.57
97.88
97.97
98.4
98.51
98.46
98.46
98.48
98.6
98.6
98.71
99.13
99.2
99.3
100.18
101.37
101.77
102.28
102.38
102.35
103.23
105.37
106.62
107
107.24
107.31
107.35
107.42
107.58
107.64
107.64
107.68
108.51
110.37
111.31
111.57
111.66
111.69
111.9
111.95
112.04
112.13
112.14
112.13
113.59
115.03
115.7
116.1
116.12
116.32
116.51
116.63
116.92
116.96
117.15


Summary of computational transaction
Raw Inputview raw input (R code)
Raw Outputview raw output of R engine
Computing time2 seconds
R Server'Gertrude Mary Cox' @ cox.wessa.net

\begin{tabular}{lllllllll}
\hline
Summary of computational transaction \tabularnewline
Raw Input & view raw input (R code)  \tabularnewline
Raw Output & view raw output of R engine  \tabularnewline
Computing time & 2 seconds \tabularnewline
R Server & 'Gertrude Mary Cox' @ cox.wessa.net \tabularnewline
\hline
\end{tabular}
%Source: https://freestatistics.org/blog/index.php?pk=&T=0

[TABLE]
[ROW][C]Summary of computational transaction[/C][/ROW]
[ROW][C]Raw Input[/C][C]view raw input (R code) [/C][/ROW]
[ROW][C]Raw Output[/C][C]view raw output of R engine [/C][/ROW]
[ROW][C]Computing time[/C][C]2 seconds[/C][/ROW]
[ROW][C]R Server[/C][C]'Gertrude Mary Cox' @ cox.wessa.net[/C][/ROW]
[/TABLE]
Source: https://freestatistics.org/blog/index.php?pk=&T=0

Globally Unique Identifier (entire table): ba.freestatistics.org/blog/index.php?pk=&T=0

As an alternative you can also use a QR Code:  

The GUIDs for individual cells are displayed in the table below:

Summary of computational transaction
Raw Inputview raw input (R code)
Raw Outputview raw output of R engine
Computing time2 seconds
R Server'Gertrude Mary Cox' @ cox.wessa.net


Estimated Parameters of Exponential Smoothing
ParameterValue
alpha0.826994050711455
beta0.00805984106598417
gamma1

\begin{tabular}{lllllllll}
\hline
Estimated Parameters of Exponential Smoothing \tabularnewline
Parameter & Value \tabularnewline
alpha & 0.826994050711455 \tabularnewline
beta & 0.00805984106598417 \tabularnewline
gamma & 1 \tabularnewline
\hline
\end{tabular}
%Source: https://freestatistics.org/blog/index.php?pk=&T=1

[TABLE]
[ROW][C]Estimated Parameters of Exponential Smoothing[/C][/ROW]
[ROW][C]Parameter[/C][C]Value[/C][/ROW]
[ROW][C]alpha[/C][C]0.826994050711455[/C][/ROW]
[ROW][C]beta[/C][C]0.00805984106598417[/C][/ROW]
[ROW][C]gamma[/C][C]1[/C][/ROW]
[/TABLE]
Source: https://freestatistics.org/blog/index.php?pk=&T=1

Globally Unique Identifier (entire table): ba.freestatistics.org/blog/index.php?pk=&T=1

As an alternative you can also use a QR Code:  

The GUIDs for individual cells are displayed in the table below:

Estimated Parameters of Exponential Smoothing
ParameterValue
alpha0.826994050711455
beta0.00805984106598417
gamma1


Interpolation Forecasts of Exponential Smoothing
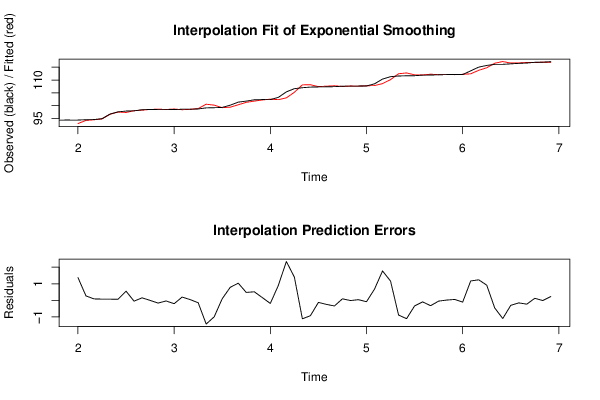
tObservedFittedResiduals
1394.3893.00654066471741.3734593352826
1494.594.23243604838320.267563951616822
1594.5794.48208110874740.0879188912525706
1694.8994.81674937132780.0732506286721843
1796.7196.63868173543990.0713182645601336
1897.5797.50435851714780.0656414828521719
1997.8897.3262975865060.553702413493994
2097.9798.0192808940578-0.0492808940578158
2198.498.24695704828920.153042951710773
2298.5198.513567959423-0.00356795942296628
2398.4698.6232565992564-0.163256599256414
2498.4698.4960668048306-0.0360668048306536
2598.4898.6821383343484-0.202138334348405
2698.698.40218357869510.197816421304935
2798.698.55567787611720.0443221238828357
2898.7198.8553436012245-0.145343601224468
2999.13100.559046262865-1.42904626286455
3099.2100.190336017582-0.990336017582294
3199.399.20110113536560.0988988646344211
32100.1899.39452243102740.785477568972652
33101.37100.3365033013151.03349669868535
34101.77101.2936835029030.476316497096789
35102.28101.7637217489770.516278251023138
36102.38102.2129936137560.167006386243855
37102.35102.537864225066-0.187864225066377
38103.23102.3295195893950.900480410604729
39105.37103.0312717644972.3387282355034
40106.62105.2155356852511.40446431474905
41107108.111981346883-1.11198134688321
42107.24108.16593999337-0.925939993369866
43107.31107.43422401255-0.124224012550258
44107.35107.592863367153-0.242863367152921
45107.42107.758340815165-0.338340815164543
46107.58107.4868828242770.0931171757229947
47107.64107.651715133176-0.0117151331760255
48107.64107.5999386687660.040061331234142
49107.68107.762304094133-0.0823040941332778
50108.51107.8334253992150.676574600784633
51110.37108.5981444148451.77185558515473
52111.31110.147094999751.16290500025013
53111.57112.454026338859-0.884026338859442
54111.66112.76563868133-1.10563868132998
55111.69112.024601355513-0.334601355512575
56111.9111.990945752015-0.0909457520154007
57111.95112.273302705201-0.323302705200774
58112.04112.085660564367-0.0456605643667842
59112.13112.1131081817010.0168918182994418
60112.14112.0853591329240.0546408670758183
61112.13112.235995273389-0.105995273389155
62113.59112.4222288563741.1677711436262
63115.03113.790957810381.23904218961967
64115.7114.783475851560.916524148439649
65116.1116.560119714454-0.460119714454478
66116.12117.216714886963-1.09671488696307
67116.32116.62220904006-0.302209040059637
68116.51116.662796441792-0.152796441791835
69116.63116.859937828568-0.229937828568239
70116.92116.7965409086530.123459091346774
71116.96116.972357475417-0.0123574754173035
72117.15116.9197220927630.230277907236612

\begin{tabular}{lllllllll}
\hline
Interpolation Forecasts of Exponential Smoothing \tabularnewline
t & Observed & Fitted & Residuals \tabularnewline
13 & 94.38 & 93.0065406647174 & 1.3734593352826 \tabularnewline
14 & 94.5 & 94.2324360483832 & 0.267563951616822 \tabularnewline
15 & 94.57 & 94.4820811087474 & 0.0879188912525706 \tabularnewline
16 & 94.89 & 94.8167493713278 & 0.0732506286721843 \tabularnewline
17 & 96.71 & 96.6386817354399 & 0.0713182645601336 \tabularnewline
18 & 97.57 & 97.5043585171478 & 0.0656414828521719 \tabularnewline
19 & 97.88 & 97.326297586506 & 0.553702413493994 \tabularnewline
20 & 97.97 & 98.0192808940578 & -0.0492808940578158 \tabularnewline
21 & 98.4 & 98.2469570482892 & 0.153042951710773 \tabularnewline
22 & 98.51 & 98.513567959423 & -0.00356795942296628 \tabularnewline
23 & 98.46 & 98.6232565992564 & -0.163256599256414 \tabularnewline
24 & 98.46 & 98.4960668048306 & -0.0360668048306536 \tabularnewline
25 & 98.48 & 98.6821383343484 & -0.202138334348405 \tabularnewline
26 & 98.6 & 98.4021835786951 & 0.197816421304935 \tabularnewline
27 & 98.6 & 98.5556778761172 & 0.0443221238828357 \tabularnewline
28 & 98.71 & 98.8553436012245 & -0.145343601224468 \tabularnewline
29 & 99.13 & 100.559046262865 & -1.42904626286455 \tabularnewline
30 & 99.2 & 100.190336017582 & -0.990336017582294 \tabularnewline
31 & 99.3 & 99.2011011353656 & 0.0988988646344211 \tabularnewline
32 & 100.18 & 99.3945224310274 & 0.785477568972652 \tabularnewline
33 & 101.37 & 100.336503301315 & 1.03349669868535 \tabularnewline
34 & 101.77 & 101.293683502903 & 0.476316497096789 \tabularnewline
35 & 102.28 & 101.763721748977 & 0.516278251023138 \tabularnewline
36 & 102.38 & 102.212993613756 & 0.167006386243855 \tabularnewline
37 & 102.35 & 102.537864225066 & -0.187864225066377 \tabularnewline
38 & 103.23 & 102.329519589395 & 0.900480410604729 \tabularnewline
39 & 105.37 & 103.031271764497 & 2.3387282355034 \tabularnewline
40 & 106.62 & 105.215535685251 & 1.40446431474905 \tabularnewline
41 & 107 & 108.111981346883 & -1.11198134688321 \tabularnewline
42 & 107.24 & 108.16593999337 & -0.925939993369866 \tabularnewline
43 & 107.31 & 107.43422401255 & -0.124224012550258 \tabularnewline
44 & 107.35 & 107.592863367153 & -0.242863367152921 \tabularnewline
45 & 107.42 & 107.758340815165 & -0.338340815164543 \tabularnewline
46 & 107.58 & 107.486882824277 & 0.0931171757229947 \tabularnewline
47 & 107.64 & 107.651715133176 & -0.0117151331760255 \tabularnewline
48 & 107.64 & 107.599938668766 & 0.040061331234142 \tabularnewline
49 & 107.68 & 107.762304094133 & -0.0823040941332778 \tabularnewline
50 & 108.51 & 107.833425399215 & 0.676574600784633 \tabularnewline
51 & 110.37 & 108.598144414845 & 1.77185558515473 \tabularnewline
52 & 111.31 & 110.14709499975 & 1.16290500025013 \tabularnewline
53 & 111.57 & 112.454026338859 & -0.884026338859442 \tabularnewline
54 & 111.66 & 112.76563868133 & -1.10563868132998 \tabularnewline
55 & 111.69 & 112.024601355513 & -0.334601355512575 \tabularnewline
56 & 111.9 & 111.990945752015 & -0.0909457520154007 \tabularnewline
57 & 111.95 & 112.273302705201 & -0.323302705200774 \tabularnewline
58 & 112.04 & 112.085660564367 & -0.0456605643667842 \tabularnewline
59 & 112.13 & 112.113108181701 & 0.0168918182994418 \tabularnewline
60 & 112.14 & 112.085359132924 & 0.0546408670758183 \tabularnewline
61 & 112.13 & 112.235995273389 & -0.105995273389155 \tabularnewline
62 & 113.59 & 112.422228856374 & 1.1677711436262 \tabularnewline
63 & 115.03 & 113.79095781038 & 1.23904218961967 \tabularnewline
64 & 115.7 & 114.78347585156 & 0.916524148439649 \tabularnewline
65 & 116.1 & 116.560119714454 & -0.460119714454478 \tabularnewline
66 & 116.12 & 117.216714886963 & -1.09671488696307 \tabularnewline
67 & 116.32 & 116.62220904006 & -0.302209040059637 \tabularnewline
68 & 116.51 & 116.662796441792 & -0.152796441791835 \tabularnewline
69 & 116.63 & 116.859937828568 & -0.229937828568239 \tabularnewline
70 & 116.92 & 116.796540908653 & 0.123459091346774 \tabularnewline
71 & 116.96 & 116.972357475417 & -0.0123574754173035 \tabularnewline
72 & 117.15 & 116.919722092763 & 0.230277907236612 \tabularnewline
\hline
\end{tabular}
%Source: https://freestatistics.org/blog/index.php?pk=&T=2

[TABLE]
[ROW][C]Interpolation Forecasts of Exponential Smoothing[/C][/ROW]
[ROW][C]t[/C][C]Observed[/C][C]Fitted[/C][C]Residuals[/C][/ROW]
[ROW][C]13[/C][C]94.38[/C][C]93.0065406647174[/C][C]1.3734593352826[/C][/ROW]
[ROW][C]14[/C][C]94.5[/C][C]94.2324360483832[/C][C]0.267563951616822[/C][/ROW]
[ROW][C]15[/C][C]94.57[/C][C]94.4820811087474[/C][C]0.0879188912525706[/C][/ROW]
[ROW][C]16[/C][C]94.89[/C][C]94.8167493713278[/C][C]0.0732506286721843[/C][/ROW]
[ROW][C]17[/C][C]96.71[/C][C]96.6386817354399[/C][C]0.0713182645601336[/C][/ROW]
[ROW][C]18[/C][C]97.57[/C][C]97.5043585171478[/C][C]0.0656414828521719[/C][/ROW]
[ROW][C]19[/C][C]97.88[/C][C]97.326297586506[/C][C]0.553702413493994[/C][/ROW]
[ROW][C]20[/C][C]97.97[/C][C]98.0192808940578[/C][C]-0.0492808940578158[/C][/ROW]
[ROW][C]21[/C][C]98.4[/C][C]98.2469570482892[/C][C]0.153042951710773[/C][/ROW]
[ROW][C]22[/C][C]98.51[/C][C]98.513567959423[/C][C]-0.00356795942296628[/C][/ROW]
[ROW][C]23[/C][C]98.46[/C][C]98.6232565992564[/C][C]-0.163256599256414[/C][/ROW]
[ROW][C]24[/C][C]98.46[/C][C]98.4960668048306[/C][C]-0.0360668048306536[/C][/ROW]
[ROW][C]25[/C][C]98.48[/C][C]98.6821383343484[/C][C]-0.202138334348405[/C][/ROW]
[ROW][C]26[/C][C]98.6[/C][C]98.4021835786951[/C][C]0.197816421304935[/C][/ROW]
[ROW][C]27[/C][C]98.6[/C][C]98.5556778761172[/C][C]0.0443221238828357[/C][/ROW]
[ROW][C]28[/C][C]98.71[/C][C]98.8553436012245[/C][C]-0.145343601224468[/C][/ROW]
[ROW][C]29[/C][C]99.13[/C][C]100.559046262865[/C][C]-1.42904626286455[/C][/ROW]
[ROW][C]30[/C][C]99.2[/C][C]100.190336017582[/C][C]-0.990336017582294[/C][/ROW]
[ROW][C]31[/C][C]99.3[/C][C]99.2011011353656[/C][C]0.0988988646344211[/C][/ROW]
[ROW][C]32[/C][C]100.18[/C][C]99.3945224310274[/C][C]0.785477568972652[/C][/ROW]
[ROW][C]33[/C][C]101.37[/C][C]100.336503301315[/C][C]1.03349669868535[/C][/ROW]
[ROW][C]34[/C][C]101.77[/C][C]101.293683502903[/C][C]0.476316497096789[/C][/ROW]
[ROW][C]35[/C][C]102.28[/C][C]101.763721748977[/C][C]0.516278251023138[/C][/ROW]
[ROW][C]36[/C][C]102.38[/C][C]102.212993613756[/C][C]0.167006386243855[/C][/ROW]
[ROW][C]37[/C][C]102.35[/C][C]102.537864225066[/C][C]-0.187864225066377[/C][/ROW]
[ROW][C]38[/C][C]103.23[/C][C]102.329519589395[/C][C]0.900480410604729[/C][/ROW]
[ROW][C]39[/C][C]105.37[/C][C]103.031271764497[/C][C]2.3387282355034[/C][/ROW]
[ROW][C]40[/C][C]106.62[/C][C]105.215535685251[/C][C]1.40446431474905[/C][/ROW]
[ROW][C]41[/C][C]107[/C][C]108.111981346883[/C][C]-1.11198134688321[/C][/ROW]
[ROW][C]42[/C][C]107.24[/C][C]108.16593999337[/C][C]-0.925939993369866[/C][/ROW]
[ROW][C]43[/C][C]107.31[/C][C]107.43422401255[/C][C]-0.124224012550258[/C][/ROW]
[ROW][C]44[/C][C]107.35[/C][C]107.592863367153[/C][C]-0.242863367152921[/C][/ROW]
[ROW][C]45[/C][C]107.42[/C][C]107.758340815165[/C][C]-0.338340815164543[/C][/ROW]
[ROW][C]46[/C][C]107.58[/C][C]107.486882824277[/C][C]0.0931171757229947[/C][/ROW]
[ROW][C]47[/C][C]107.64[/C][C]107.651715133176[/C][C]-0.0117151331760255[/C][/ROW]
[ROW][C]48[/C][C]107.64[/C][C]107.599938668766[/C][C]0.040061331234142[/C][/ROW]
[ROW][C]49[/C][C]107.68[/C][C]107.762304094133[/C][C]-0.0823040941332778[/C][/ROW]
[ROW][C]50[/C][C]108.51[/C][C]107.833425399215[/C][C]0.676574600784633[/C][/ROW]
[ROW][C]51[/C][C]110.37[/C][C]108.598144414845[/C][C]1.77185558515473[/C][/ROW]
[ROW][C]52[/C][C]111.31[/C][C]110.14709499975[/C][C]1.16290500025013[/C][/ROW]
[ROW][C]53[/C][C]111.57[/C][C]112.454026338859[/C][C]-0.884026338859442[/C][/ROW]
[ROW][C]54[/C][C]111.66[/C][C]112.76563868133[/C][C]-1.10563868132998[/C][/ROW]
[ROW][C]55[/C][C]111.69[/C][C]112.024601355513[/C][C]-0.334601355512575[/C][/ROW]
[ROW][C]56[/C][C]111.9[/C][C]111.990945752015[/C][C]-0.0909457520154007[/C][/ROW]
[ROW][C]57[/C][C]111.95[/C][C]112.273302705201[/C][C]-0.323302705200774[/C][/ROW]
[ROW][C]58[/C][C]112.04[/C][C]112.085660564367[/C][C]-0.0456605643667842[/C][/ROW]
[ROW][C]59[/C][C]112.13[/C][C]112.113108181701[/C][C]0.0168918182994418[/C][/ROW]
[ROW][C]60[/C][C]112.14[/C][C]112.085359132924[/C][C]0.0546408670758183[/C][/ROW]
[ROW][C]61[/C][C]112.13[/C][C]112.235995273389[/C][C]-0.105995273389155[/C][/ROW]
[ROW][C]62[/C][C]113.59[/C][C]112.422228856374[/C][C]1.1677711436262[/C][/ROW]
[ROW][C]63[/C][C]115.03[/C][C]113.79095781038[/C][C]1.23904218961967[/C][/ROW]
[ROW][C]64[/C][C]115.7[/C][C]114.78347585156[/C][C]0.916524148439649[/C][/ROW]
[ROW][C]65[/C][C]116.1[/C][C]116.560119714454[/C][C]-0.460119714454478[/C][/ROW]
[ROW][C]66[/C][C]116.12[/C][C]117.216714886963[/C][C]-1.09671488696307[/C][/ROW]
[ROW][C]67[/C][C]116.32[/C][C]116.62220904006[/C][C]-0.302209040059637[/C][/ROW]
[ROW][C]68[/C][C]116.51[/C][C]116.662796441792[/C][C]-0.152796441791835[/C][/ROW]
[ROW][C]69[/C][C]116.63[/C][C]116.859937828568[/C][C]-0.229937828568239[/C][/ROW]
[ROW][C]70[/C][C]116.92[/C][C]116.796540908653[/C][C]0.123459091346774[/C][/ROW]
[ROW][C]71[/C][C]116.96[/C][C]116.972357475417[/C][C]-0.0123574754173035[/C][/ROW]
[ROW][C]72[/C][C]117.15[/C][C]116.919722092763[/C][C]0.230277907236612[/C][/ROW]
[/TABLE]
Source: https://freestatistics.org/blog/index.php?pk=&T=2

Globally Unique Identifier (entire table): ba.freestatistics.org/blog/index.php?pk=&T=2

As an alternative you can also use a QR Code:  

The GUIDs for individual cells are displayed in the table below:

Interpolation Forecasts of Exponential Smoothing
tObservedFittedResiduals
1394.3893.00654066471741.3734593352826
1494.594.23243604838320.267563951616822
1594.5794.48208110874740.0879188912525706
1694.8994.81674937132780.0732506286721843
1796.7196.63868173543990.0713182645601336
1897.5797.50435851714780.0656414828521719
1997.8897.3262975865060.553702413493994
2097.9798.0192808940578-0.0492808940578158
2198.498.24695704828920.153042951710773
2298.5198.513567959423-0.00356795942296628
2398.4698.6232565992564-0.163256599256414
2498.4698.4960668048306-0.0360668048306536
2598.4898.6821383343484-0.202138334348405
2698.698.40218357869510.197816421304935
2798.698.55567787611720.0443221238828357
2898.7198.8553436012245-0.145343601224468
2999.13100.559046262865-1.42904626286455
3099.2100.190336017582-0.990336017582294
3199.399.20110113536560.0988988646344211
32100.1899.39452243102740.785477568972652
33101.37100.3365033013151.03349669868535
34101.77101.2936835029030.476316497096789
35102.28101.7637217489770.516278251023138
36102.38102.2129936137560.167006386243855
37102.35102.537864225066-0.187864225066377
38103.23102.3295195893950.900480410604729
39105.37103.0312717644972.3387282355034
40106.62105.2155356852511.40446431474905
41107108.111981346883-1.11198134688321
42107.24108.16593999337-0.925939993369866
43107.31107.43422401255-0.124224012550258
44107.35107.592863367153-0.242863367152921
45107.42107.758340815165-0.338340815164543
46107.58107.4868828242770.0931171757229947
47107.64107.651715133176-0.0117151331760255
48107.64107.5999386687660.040061331234142
49107.68107.762304094133-0.0823040941332778
50108.51107.8334253992150.676574600784633
51110.37108.5981444148451.77185558515473
52111.31110.147094999751.16290500025013
53111.57112.454026338859-0.884026338859442
54111.66112.76563868133-1.10563868132998
55111.69112.024601355513-0.334601355512575
56111.9111.990945752015-0.0909457520154007
57111.95112.273302705201-0.323302705200774
58112.04112.085660564367-0.0456605643667842
59112.13112.1131081817010.0168918182994418
60112.14112.0853591329240.0546408670758183
61112.13112.235995273389-0.105995273389155
62113.59112.4222288563741.1677711436262
63115.03113.790957810381.23904218961967
64115.7114.783475851560.916524148439649
65116.1116.560119714454-0.460119714454478
66116.12117.216714886963-1.09671488696307
67116.32116.62220904006-0.302209040059637
68116.51116.662796441792-0.152796441791835
69116.63116.859937828568-0.229937828568239
70116.92116.7965409086530.123459091346774
71116.96116.972357475417-0.0123574754173035
72117.15116.9197220927630.230277907236612


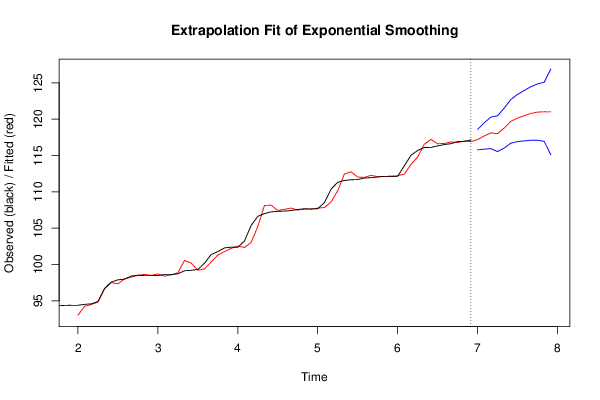
Extrapolation Forecasts of Exponential Smoothing
tForecast95% Lower Bound95% Upper Bound
73117.186318792468115.787347108906118.585290476031
74117.696632574746115.874082981903119.519182167588
75118.115248854225115.945387616607120.285110091843
76118.008669268872115.542402833655120.474935704089
77118.785233409734116.037285153129121.533181666338
78119.714862003116116.702851557672122.72687244856
79120.166230184707116.9161353911123.416324978315
80120.482046730457117.009672411321123.954421049594
81120.792456041404117.108260985474124.476651097333
82120.977869534217117.093958307374124.86178076106
83121.020144987001116.94816257771125.092127396293
84121.010046540799115.098327622007126.921765459591

\begin{tabular}{lllllllll}
\hline
Extrapolation Forecasts of Exponential Smoothing \tabularnewline
t & Forecast & 95% Lower Bound & 95% Upper Bound \tabularnewline
73 & 117.186318792468 & 115.787347108906 & 118.585290476031 \tabularnewline
74 & 117.696632574746 & 115.874082981903 & 119.519182167588 \tabularnewline
75 & 118.115248854225 & 115.945387616607 & 120.285110091843 \tabularnewline
76 & 118.008669268872 & 115.542402833655 & 120.474935704089 \tabularnewline
77 & 118.785233409734 & 116.037285153129 & 121.533181666338 \tabularnewline
78 & 119.714862003116 & 116.702851557672 & 122.72687244856 \tabularnewline
79 & 120.166230184707 & 116.9161353911 & 123.416324978315 \tabularnewline
80 & 120.482046730457 & 117.009672411321 & 123.954421049594 \tabularnewline
81 & 120.792456041404 & 117.108260985474 & 124.476651097333 \tabularnewline
82 & 120.977869534217 & 117.093958307374 & 124.86178076106 \tabularnewline
83 & 121.020144987001 & 116.94816257771 & 125.092127396293 \tabularnewline
84 & 121.010046540799 & 115.098327622007 & 126.921765459591 \tabularnewline
\hline
\end{tabular}
%Source: https://freestatistics.org/blog/index.php?pk=&T=3

[TABLE]
[ROW][C]Extrapolation Forecasts of Exponential Smoothing[/C][/ROW]
[ROW][C]t[/C][C]Forecast[/C][C]95% Lower Bound[/C][C]95% Upper Bound[/C][/ROW]
[ROW][C]73[/C][C]117.186318792468[/C][C]115.787347108906[/C][C]118.585290476031[/C][/ROW]
[ROW][C]74[/C][C]117.696632574746[/C][C]115.874082981903[/C][C]119.519182167588[/C][/ROW]
[ROW][C]75[/C][C]118.115248854225[/C][C]115.945387616607[/C][C]120.285110091843[/C][/ROW]
[ROW][C]76[/C][C]118.008669268872[/C][C]115.542402833655[/C][C]120.474935704089[/C][/ROW]
[ROW][C]77[/C][C]118.785233409734[/C][C]116.037285153129[/C][C]121.533181666338[/C][/ROW]
[ROW][C]78[/C][C]119.714862003116[/C][C]116.702851557672[/C][C]122.72687244856[/C][/ROW]
[ROW][C]79[/C][C]120.166230184707[/C][C]116.9161353911[/C][C]123.416324978315[/C][/ROW]
[ROW][C]80[/C][C]120.482046730457[/C][C]117.009672411321[/C][C]123.954421049594[/C][/ROW]
[ROW][C]81[/C][C]120.792456041404[/C][C]117.108260985474[/C][C]124.476651097333[/C][/ROW]
[ROW][C]82[/C][C]120.977869534217[/C][C]117.093958307374[/C][C]124.86178076106[/C][/ROW]
[ROW][C]83[/C][C]121.020144987001[/C][C]116.94816257771[/C][C]125.092127396293[/C][/ROW]
[ROW][C]84[/C][C]121.010046540799[/C][C]115.098327622007[/C][C]126.921765459591[/C][/ROW]
[/TABLE]
Source: https://freestatistics.org/blog/index.php?pk=&T=3

Globally Unique Identifier (entire table): ba.freestatistics.org/blog/index.php?pk=&T=3

As an alternative you can also use a QR Code:  

The GUIDs for individual cells are displayed in the table below:

Extrapolation Forecasts of Exponential Smoothing
tForecast95% Lower Bound95% Upper Bound
73117.186318792468115.787347108906118.585290476031
74117.696632574746115.874082981903119.519182167588
75118.115248854225115.945387616607120.285110091843
76118.008669268872115.542402833655120.474935704089
77118.785233409734116.037285153129121.533181666338
78119.714862003116116.702851557672122.72687244856
79120.166230184707116.9161353911123.416324978315
80120.482046730457117.009672411321123.954421049594
81120.792456041404117.108260985474124.476651097333
82120.977869534217117.093958307374124.86178076106
83121.020144987001116.94816257771125.092127396293
84121.010046540799115.098327622007126.921765459591


Parameters (Session):
par1 = additive ; par2 = 12 ;
Parameters (R input):
par1 = 12 ; par2 = Triple ; par3 = multiplicative ;
R code (references can be found in the software module):
par1 <- as.numeric(par1)
if (par2 == 'Single') K <- 1
if (par2 == 'Double') K <- 2
if (par2 == 'Triple') K <- par1
nx <- length(x)
nxmK <- nx - K
x <- ts(x, frequency = par1)
if (par2 == 'Single') fit <- HoltWinters(x, gamma=F, beta=F)
if (par2 == 'Double') fit <- HoltWinters(x, gamma=F)
if (par2 == 'Triple') fit <- HoltWinters(x, seasonal=par3)
fit
myresid <- x - fit$fitted[,'xhat']
bitmap(file='test1.png')
op <- par(mfrow=c(2,1))
plot(fit,ylab='Observed (black) / Fitted (red)',main='Interpolation Fit of Exponential Smoothing')
plot(myresid,ylab='Residuals',main='Interpolation Prediction Errors')
par(op)
dev.off()
bitmap(file='test2.png')
p <- predict(fit, par1, prediction.interval=TRUE)
np <- length(p[,1])
plot(fit,p,ylab='Observed (black) / Fitted (red)',main='Extrapolation Fit of Exponential Smoothing')
dev.off()
bitmap(file='test3.png')
op <- par(mfrow = c(2,2))
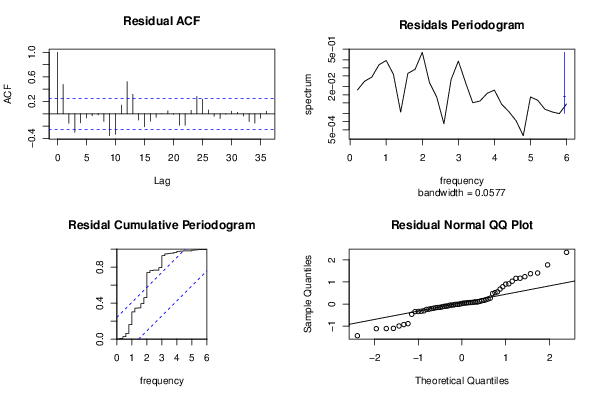
acf(as.numeric(myresid),lag.max = nx/2,main='Residual ACF')
spectrum(myresid,main='Residals Periodogram')
cpgram(myresid,main='Residal Cumulative Periodogram')
qqnorm(myresid,main='Residual Normal QQ Plot')
qqline(myresid)
par(op)
dev.off()
load(file='createtable')
a<-table.start()
a<-table.row.start(a)
a<-table.element(a,'Estimated Parameters of Exponential Smoothing',2,TRUE)
a<-table.row.end(a)
a<-table.row.start(a)
a<-table.element(a,'Parameter',header=TRUE)
a<-table.element(a,'Value',header=TRUE)
a<-table.row.end(a)
a<-table.row.start(a)
a<-table.element(a,'alpha',header=TRUE)
a<-table.element(a,fit$alpha)
a<-table.row.end(a)
a<-table.row.start(a)
a<-table.element(a,'beta',header=TRUE)
a<-table.element(a,fit$beta)
a<-table.row.end(a)
a<-table.row.start(a)
a<-table.element(a,'gamma',header=TRUE)
a<-table.element(a,fit$gamma)
a<-table.row.end(a)
a<-table.end(a)
table.save(a,file='mytable.tab')
a<-table.start()
a<-table.row.start(a)
a<-table.element(a,'Interpolation Forecasts of Exponential Smoothing',4,TRUE)
a<-table.row.end(a)
a<-table.row.start(a)
a<-table.element(a,'t',header=TRUE)
a<-table.element(a,'Observed',header=TRUE)
a<-table.element(a,'Fitted',header=TRUE)
a<-table.element(a,'Residuals',header=TRUE)
a<-table.row.end(a)
for (i in 1:nxmK) {
a<-table.row.start(a)
a<-table.element(a,i+K,header=TRUE)
a<-table.element(a,x[i+K])
a<-table.element(a,fit$fitted[i,'xhat'])
a<-table.element(a,myresid[i])
a<-table.row.end(a)
}
a<-table.end(a)
table.save(a,file='mytable1.tab')
a<-table.start()
a<-table.row.start(a)
a<-table.element(a,'Extrapolation Forecasts of Exponential Smoothing',4,TRUE)
a<-table.row.end(a)
a<-table.row.start(a)
a<-table.element(a,'t',header=TRUE)
a<-table.element(a,'Forecast',header=TRUE)
a<-table.element(a,'95% Lower Bound',header=TRUE)
a<-table.element(a,'95% Upper Bound',header=TRUE)
a<-table.row.end(a)
for (i in 1:np) {
a<-table.row.start(a)
a<-table.element(a,nx+i,header=TRUE)
a<-table.element(a,p[i,'fit'])
a<-table.element(a,p[i,'lwr'])
a<-table.element(a,p[i,'upr'])
a<-table.row.end(a)
}
a<-table.end(a)
table.save(a,file='mytable2.tab')