Free Statistics

of Irreproducible Research!

Author's title

Author*Unverified author*
R Software Modulerwasp_autocorrelation.wasp
Title produced by software(Partial) Autocorrelation Function
Date of computationFri, 19 May 2017 00:55:53 +0100
Cite this page as followsStatistical Computations at FreeStatistics.org, Office for Research Development and Education, URL https://freestatistics.org/blog/index.php?v=date/2017/May/19/t1495151780ufqe6zhnlqsmy4e.htm/, Retrieved Wed, 15 May 2024 21:13:34 +0200
Statistical Computations at FreeStatistics.org, Office for Research Development and Education, URL https://freestatistics.org/blog/index.php?pk=, Retrieved Wed, 15 May 2024 21:13:34 +0200
QR Codes:

Original text written by user:
IsPrivate?No (this computation is public)
User-defined keywords
Estimated Impact0
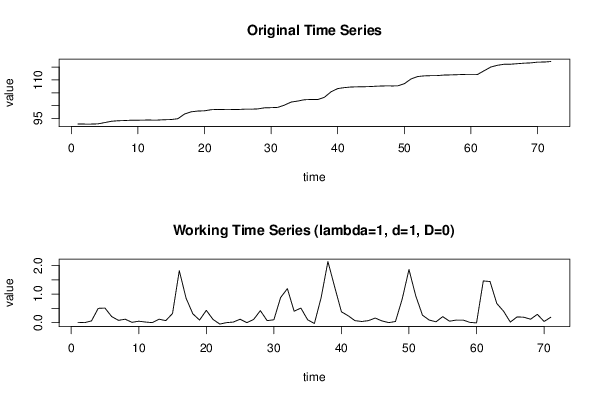
Dataseries X:
92.81
92.82
92.82
92.88
93.38
93.89
94.1
94.18
94.3
94.31
94.36
94.38
94.38
94.5
94.57
94.89
96.71
97.57
97.88
97.97
98.4
98.51
98.46
98.46
98.48
98.6
98.6
98.71
99.13
99.2
99.3
100.18
101.37
101.77
102.28
102.38
102.35
103.23
105.37
106.62
107
107.24
107.31
107.35
107.42
107.58
107.64
107.64
107.68
108.51
110.37
111.31
111.57
111.66
111.69
111.9
111.95
112.04
112.13
112.14
112.13
113.59
115.03
115.7
116.1
116.12
116.32
116.51
116.63
116.92
116.96
117.15


Summary of computational transaction
Raw Inputview raw input (R code)
Raw Outputview raw output of R engine
Computing time1 seconds
R Server'Gertrude Mary Cox' @ cox.wessa.net

\begin{tabular}{lllllllll}
\hline
Summary of computational transaction \tabularnewline
Raw Input & view raw input (R code)  \tabularnewline
Raw Output & view raw output of R engine  \tabularnewline
Computing time & 1 seconds \tabularnewline
R Server & 'Gertrude Mary Cox' @ cox.wessa.net \tabularnewline
\hline
\end{tabular}
%Source: https://freestatistics.org/blog/index.php?pk=&T=0

[TABLE]
[ROW][C]Summary of computational transaction[/C][/ROW]
[ROW][C]Raw Input[/C][C]view raw input (R code) [/C][/ROW]
[ROW][C]Raw Output[/C][C]view raw output of R engine [/C][/ROW]
[ROW][C]Computing time[/C][C]1 seconds[/C][/ROW]
[ROW][C]R Server[/C][C]'Gertrude Mary Cox' @ cox.wessa.net[/C][/ROW]
[/TABLE]
Source: https://freestatistics.org/blog/index.php?pk=&T=0

Globally Unique Identifier (entire table): ba.freestatistics.org/blog/index.php?pk=&T=0

As an alternative you can also use a QR Code:  

The GUIDs for individual cells are displayed in the table below:

Summary of computational transaction
Raw Inputview raw input (R code)
Raw Outputview raw output of R engine
Computing time1 seconds
R Server'Gertrude Mary Cox' @ cox.wessa.net


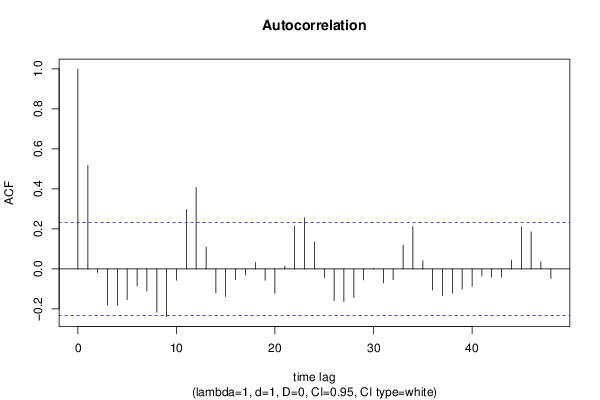
Autocorrelation Function
Time lag kACF(k)T-STATP-value
10.5169954.35632.2e-05
2-0.017668-0.14890.441038
3-0.181252-1.52730.06557
4-0.181221-1.5270.065602
5-0.153088-1.28990.100629
6-0.084769-0.71430.238699
7-0.109538-0.9230.179571
8-0.216064-1.82060.036442
9-0.238389-2.00870.024186
10-0.055807-0.47020.319814
110.29662.49920.007381
120.4076013.43450.000497
130.1093860.92170.179903
14-0.119544-1.00730.158608
15-0.137344-1.15730.125519
16-0.05325-0.44870.32751
17-0.029726-0.25050.401473
180.0327050.27560.391838
19-0.056354-0.47480.318178
20-0.121335-1.02240.155035
210.0136750.11520.454294
220.2129961.79470.038476
230.2562162.15890.017119
240.1342771.13140.130839
25-0.043866-0.36960.356381
26-0.157806-1.32970.093937
27-0.162729-1.37120.087319
28-0.142121-1.19750.117541
29-0.055477-0.46750.320803
30-0.001027-0.00870.49656
31-0.070217-0.59170.277979
32-0.053178-0.44810.327729
330.1191261.00380.159447
340.2117571.78430.039324
350.0410350.34580.365269
36-0.104898-0.88390.18987
37-0.133482-1.12470.132244
38-0.120478-1.01520.156736
39-0.100629-0.84790.199667
40-0.086865-0.73190.233307
41-0.035225-0.29680.383738
42-0.039828-0.33560.369083
43-0.041437-0.34920.364005
440.0443490.37370.354875
450.2114621.78180.039528
460.1855871.56380.061158
470.0365440.30790.37952
48-0.047822-0.4030.344096

\begin{tabular}{lllllllll}
\hline
Autocorrelation Function \tabularnewline
Time lag k & ACF(k) & T-STAT & P-value \tabularnewline
1 & 0.516995 & 4.3563 & 2.2e-05 \tabularnewline
2 & -0.017668 & -0.1489 & 0.441038 \tabularnewline
3 & -0.181252 & -1.5273 & 0.06557 \tabularnewline
4 & -0.181221 & -1.527 & 0.065602 \tabularnewline
5 & -0.153088 & -1.2899 & 0.100629 \tabularnewline
6 & -0.084769 & -0.7143 & 0.238699 \tabularnewline
7 & -0.109538 & -0.923 & 0.179571 \tabularnewline
8 & -0.216064 & -1.8206 & 0.036442 \tabularnewline
9 & -0.238389 & -2.0087 & 0.024186 \tabularnewline
10 & -0.055807 & -0.4702 & 0.319814 \tabularnewline
11 & 0.2966 & 2.4992 & 0.007381 \tabularnewline
12 & 0.407601 & 3.4345 & 0.000497 \tabularnewline
13 & 0.109386 & 0.9217 & 0.179903 \tabularnewline
14 & -0.119544 & -1.0073 & 0.158608 \tabularnewline
15 & -0.137344 & -1.1573 & 0.125519 \tabularnewline
16 & -0.05325 & -0.4487 & 0.32751 \tabularnewline
17 & -0.029726 & -0.2505 & 0.401473 \tabularnewline
18 & 0.032705 & 0.2756 & 0.391838 \tabularnewline
19 & -0.056354 & -0.4748 & 0.318178 \tabularnewline
20 & -0.121335 & -1.0224 & 0.155035 \tabularnewline
21 & 0.013675 & 0.1152 & 0.454294 \tabularnewline
22 & 0.212996 & 1.7947 & 0.038476 \tabularnewline
23 & 0.256216 & 2.1589 & 0.017119 \tabularnewline
24 & 0.134277 & 1.1314 & 0.130839 \tabularnewline
25 & -0.043866 & -0.3696 & 0.356381 \tabularnewline
26 & -0.157806 & -1.3297 & 0.093937 \tabularnewline
27 & -0.162729 & -1.3712 & 0.087319 \tabularnewline
28 & -0.142121 & -1.1975 & 0.117541 \tabularnewline
29 & -0.055477 & -0.4675 & 0.320803 \tabularnewline
30 & -0.001027 & -0.0087 & 0.49656 \tabularnewline
31 & -0.070217 & -0.5917 & 0.277979 \tabularnewline
32 & -0.053178 & -0.4481 & 0.327729 \tabularnewline
33 & 0.119126 & 1.0038 & 0.159447 \tabularnewline
34 & 0.211757 & 1.7843 & 0.039324 \tabularnewline
35 & 0.041035 & 0.3458 & 0.365269 \tabularnewline
36 & -0.104898 & -0.8839 & 0.18987 \tabularnewline
37 & -0.133482 & -1.1247 & 0.132244 \tabularnewline
38 & -0.120478 & -1.0152 & 0.156736 \tabularnewline
39 & -0.100629 & -0.8479 & 0.199667 \tabularnewline
40 & -0.086865 & -0.7319 & 0.233307 \tabularnewline
41 & -0.035225 & -0.2968 & 0.383738 \tabularnewline
42 & -0.039828 & -0.3356 & 0.369083 \tabularnewline
43 & -0.041437 & -0.3492 & 0.364005 \tabularnewline
44 & 0.044349 & 0.3737 & 0.354875 \tabularnewline
45 & 0.211462 & 1.7818 & 0.039528 \tabularnewline
46 & 0.185587 & 1.5638 & 0.061158 \tabularnewline
47 & 0.036544 & 0.3079 & 0.37952 \tabularnewline
48 & -0.047822 & -0.403 & 0.344096 \tabularnewline
\hline
\end{tabular}
%Source: https://freestatistics.org/blog/index.php?pk=&T=1

[TABLE]
[ROW][C]Autocorrelation Function[/C][/ROW]
[ROW][C]Time lag k[/C][C]ACF(k)[/C][C]T-STAT[/C][C]P-value[/C][/ROW]
[ROW][C]1[/C][C]0.516995[/C][C]4.3563[/C][C]2.2e-05[/C][/ROW]
[ROW][C]2[/C][C]-0.017668[/C][C]-0.1489[/C][C]0.441038[/C][/ROW]
[ROW][C]3[/C][C]-0.181252[/C][C]-1.5273[/C][C]0.06557[/C][/ROW]
[ROW][C]4[/C][C]-0.181221[/C][C]-1.527[/C][C]0.065602[/C][/ROW]
[ROW][C]5[/C][C]-0.153088[/C][C]-1.2899[/C][C]0.100629[/C][/ROW]
[ROW][C]6[/C][C]-0.084769[/C][C]-0.7143[/C][C]0.238699[/C][/ROW]
[ROW][C]7[/C][C]-0.109538[/C][C]-0.923[/C][C]0.179571[/C][/ROW]
[ROW][C]8[/C][C]-0.216064[/C][C]-1.8206[/C][C]0.036442[/C][/ROW]
[ROW][C]9[/C][C]-0.238389[/C][C]-2.0087[/C][C]0.024186[/C][/ROW]
[ROW][C]10[/C][C]-0.055807[/C][C]-0.4702[/C][C]0.319814[/C][/ROW]
[ROW][C]11[/C][C]0.2966[/C][C]2.4992[/C][C]0.007381[/C][/ROW]
[ROW][C]12[/C][C]0.407601[/C][C]3.4345[/C][C]0.000497[/C][/ROW]
[ROW][C]13[/C][C]0.109386[/C][C]0.9217[/C][C]0.179903[/C][/ROW]
[ROW][C]14[/C][C]-0.119544[/C][C]-1.0073[/C][C]0.158608[/C][/ROW]
[ROW][C]15[/C][C]-0.137344[/C][C]-1.1573[/C][C]0.125519[/C][/ROW]
[ROW][C]16[/C][C]-0.05325[/C][C]-0.4487[/C][C]0.32751[/C][/ROW]
[ROW][C]17[/C][C]-0.029726[/C][C]-0.2505[/C][C]0.401473[/C][/ROW]
[ROW][C]18[/C][C]0.032705[/C][C]0.2756[/C][C]0.391838[/C][/ROW]
[ROW][C]19[/C][C]-0.056354[/C][C]-0.4748[/C][C]0.318178[/C][/ROW]
[ROW][C]20[/C][C]-0.121335[/C][C]-1.0224[/C][C]0.155035[/C][/ROW]
[ROW][C]21[/C][C]0.013675[/C][C]0.1152[/C][C]0.454294[/C][/ROW]
[ROW][C]22[/C][C]0.212996[/C][C]1.7947[/C][C]0.038476[/C][/ROW]
[ROW][C]23[/C][C]0.256216[/C][C]2.1589[/C][C]0.017119[/C][/ROW]
[ROW][C]24[/C][C]0.134277[/C][C]1.1314[/C][C]0.130839[/C][/ROW]
[ROW][C]25[/C][C]-0.043866[/C][C]-0.3696[/C][C]0.356381[/C][/ROW]
[ROW][C]26[/C][C]-0.157806[/C][C]-1.3297[/C][C]0.093937[/C][/ROW]
[ROW][C]27[/C][C]-0.162729[/C][C]-1.3712[/C][C]0.087319[/C][/ROW]
[ROW][C]28[/C][C]-0.142121[/C][C]-1.1975[/C][C]0.117541[/C][/ROW]
[ROW][C]29[/C][C]-0.055477[/C][C]-0.4675[/C][C]0.320803[/C][/ROW]
[ROW][C]30[/C][C]-0.001027[/C][C]-0.0087[/C][C]0.49656[/C][/ROW]
[ROW][C]31[/C][C]-0.070217[/C][C]-0.5917[/C][C]0.277979[/C][/ROW]
[ROW][C]32[/C][C]-0.053178[/C][C]-0.4481[/C][C]0.327729[/C][/ROW]
[ROW][C]33[/C][C]0.119126[/C][C]1.0038[/C][C]0.159447[/C][/ROW]
[ROW][C]34[/C][C]0.211757[/C][C]1.7843[/C][C]0.039324[/C][/ROW]
[ROW][C]35[/C][C]0.041035[/C][C]0.3458[/C][C]0.365269[/C][/ROW]
[ROW][C]36[/C][C]-0.104898[/C][C]-0.8839[/C][C]0.18987[/C][/ROW]
[ROW][C]37[/C][C]-0.133482[/C][C]-1.1247[/C][C]0.132244[/C][/ROW]
[ROW][C]38[/C][C]-0.120478[/C][C]-1.0152[/C][C]0.156736[/C][/ROW]
[ROW][C]39[/C][C]-0.100629[/C][C]-0.8479[/C][C]0.199667[/C][/ROW]
[ROW][C]40[/C][C]-0.086865[/C][C]-0.7319[/C][C]0.233307[/C][/ROW]
[ROW][C]41[/C][C]-0.035225[/C][C]-0.2968[/C][C]0.383738[/C][/ROW]
[ROW][C]42[/C][C]-0.039828[/C][C]-0.3356[/C][C]0.369083[/C][/ROW]
[ROW][C]43[/C][C]-0.041437[/C][C]-0.3492[/C][C]0.364005[/C][/ROW]
[ROW][C]44[/C][C]0.044349[/C][C]0.3737[/C][C]0.354875[/C][/ROW]
[ROW][C]45[/C][C]0.211462[/C][C]1.7818[/C][C]0.039528[/C][/ROW]
[ROW][C]46[/C][C]0.185587[/C][C]1.5638[/C][C]0.061158[/C][/ROW]
[ROW][C]47[/C][C]0.036544[/C][C]0.3079[/C][C]0.37952[/C][/ROW]
[ROW][C]48[/C][C]-0.047822[/C][C]-0.403[/C][C]0.344096[/C][/ROW]
[/TABLE]
Source: https://freestatistics.org/blog/index.php?pk=&T=1

Globally Unique Identifier (entire table): ba.freestatistics.org/blog/index.php?pk=&T=1

As an alternative you can also use a QR Code:  

The GUIDs for individual cells are displayed in the table below:

Autocorrelation Function
Time lag kACF(k)T-STATP-value
10.5169954.35632.2e-05
2-0.017668-0.14890.441038
3-0.181252-1.52730.06557
4-0.181221-1.5270.065602
5-0.153088-1.28990.100629
6-0.084769-0.71430.238699
7-0.109538-0.9230.179571
8-0.216064-1.82060.036442
9-0.238389-2.00870.024186
10-0.055807-0.47020.319814
110.29662.49920.007381
120.4076013.43450.000497
130.1093860.92170.179903
14-0.119544-1.00730.158608
15-0.137344-1.15730.125519
16-0.05325-0.44870.32751
17-0.029726-0.25050.401473
180.0327050.27560.391838
19-0.056354-0.47480.318178
20-0.121335-1.02240.155035
210.0136750.11520.454294
220.2129961.79470.038476
230.2562162.15890.017119
240.1342771.13140.130839
25-0.043866-0.36960.356381
26-0.157806-1.32970.093937
27-0.162729-1.37120.087319
28-0.142121-1.19750.117541
29-0.055477-0.46750.320803
30-0.001027-0.00870.49656
31-0.070217-0.59170.277979
32-0.053178-0.44810.327729
330.1191261.00380.159447
340.2117571.78430.039324
350.0410350.34580.365269
36-0.104898-0.88390.18987
37-0.133482-1.12470.132244
38-0.120478-1.01520.156736
39-0.100629-0.84790.199667
40-0.086865-0.73190.233307
41-0.035225-0.29680.383738
42-0.039828-0.33560.369083
43-0.041437-0.34920.364005
440.0443490.37370.354875
450.2114621.78180.039528
460.1855871.56380.061158
470.0365440.30790.37952
48-0.047822-0.4030.344096


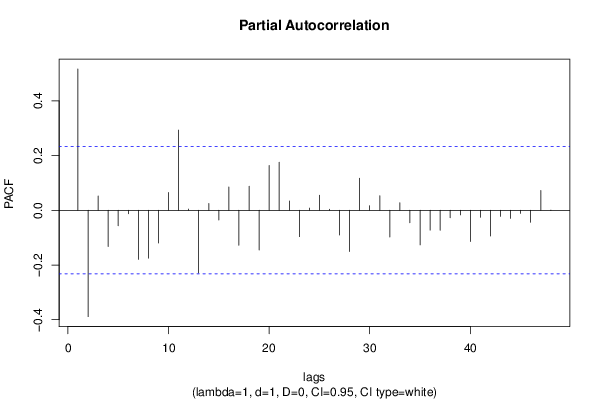
Partial Autocorrelation Function
Time lag kPACF(k)T-STATP-value
10.5169954.35632.2e-05
2-0.388899-3.27690.000813
30.0522490.44030.330545
4-0.132112-1.11320.13469
5-0.056746-0.47820.317006
6-0.012894-0.10860.456894
7-0.17936-1.51130.067574
8-0.174881-1.47360.072508
9-0.119571-1.00750.158552
100.0653280.55050.291864
110.2932632.47110.007936
120.0043720.03680.485358
13-0.229319-1.93230.028658
140.0250290.21090.416785
15-0.035565-0.29970.38265
160.0851210.71720.237788
17-0.127657-1.07570.142862
180.0878290.74010.230851
19-0.145316-1.22450.112415
200.164031.38210.08563
210.1755911.47960.071708
220.0343770.28970.386458
23-0.096194-0.81050.210168
240.0080450.06780.473073
250.0553610.46650.321151
260.0038590.03250.487075
27-0.090441-0.76210.224273
28-0.150464-1.26780.1045
290.1171270.98690.163515
300.0170160.14340.443197
310.0535020.45080.326748
32-0.0976-0.82240.206804
330.027730.23370.407963
34-0.045724-0.38530.350592
35-0.126404-1.06510.14522
36-0.072454-0.61050.271739
37-0.073109-0.6160.269923
38-0.027008-0.22760.410317
39-0.016733-0.1410.444138
40-0.113871-0.95950.170283
41-0.025664-0.21630.414706
42-0.093842-0.79070.215868
43-0.022332-0.18820.425638
44-0.02962-0.24960.401817
45-0.011198-0.09440.462544
46-0.043755-0.36870.356729
470.0725830.61160.27138
48-0.000676-0.00570.497737

\begin{tabular}{lllllllll}
\hline
Partial Autocorrelation Function \tabularnewline
Time lag k & PACF(k) & T-STAT & P-value \tabularnewline
1 & 0.516995 & 4.3563 & 2.2e-05 \tabularnewline
2 & -0.388899 & -3.2769 & 0.000813 \tabularnewline
3 & 0.052249 & 0.4403 & 0.330545 \tabularnewline
4 & -0.132112 & -1.1132 & 0.13469 \tabularnewline
5 & -0.056746 & -0.4782 & 0.317006 \tabularnewline
6 & -0.012894 & -0.1086 & 0.456894 \tabularnewline
7 & -0.17936 & -1.5113 & 0.067574 \tabularnewline
8 & -0.174881 & -1.4736 & 0.072508 \tabularnewline
9 & -0.119571 & -1.0075 & 0.158552 \tabularnewline
10 & 0.065328 & 0.5505 & 0.291864 \tabularnewline
11 & 0.293263 & 2.4711 & 0.007936 \tabularnewline
12 & 0.004372 & 0.0368 & 0.485358 \tabularnewline
13 & -0.229319 & -1.9323 & 0.028658 \tabularnewline
14 & 0.025029 & 0.2109 & 0.416785 \tabularnewline
15 & -0.035565 & -0.2997 & 0.38265 \tabularnewline
16 & 0.085121 & 0.7172 & 0.237788 \tabularnewline
17 & -0.127657 & -1.0757 & 0.142862 \tabularnewline
18 & 0.087829 & 0.7401 & 0.230851 \tabularnewline
19 & -0.145316 & -1.2245 & 0.112415 \tabularnewline
20 & 0.16403 & 1.3821 & 0.08563 \tabularnewline
21 & 0.175591 & 1.4796 & 0.071708 \tabularnewline
22 & 0.034377 & 0.2897 & 0.386458 \tabularnewline
23 & -0.096194 & -0.8105 & 0.210168 \tabularnewline
24 & 0.008045 & 0.0678 & 0.473073 \tabularnewline
25 & 0.055361 & 0.4665 & 0.321151 \tabularnewline
26 & 0.003859 & 0.0325 & 0.487075 \tabularnewline
27 & -0.090441 & -0.7621 & 0.224273 \tabularnewline
28 & -0.150464 & -1.2678 & 0.1045 \tabularnewline
29 & 0.117127 & 0.9869 & 0.163515 \tabularnewline
30 & 0.017016 & 0.1434 & 0.443197 \tabularnewline
31 & 0.053502 & 0.4508 & 0.326748 \tabularnewline
32 & -0.0976 & -0.8224 & 0.206804 \tabularnewline
33 & 0.02773 & 0.2337 & 0.407963 \tabularnewline
34 & -0.045724 & -0.3853 & 0.350592 \tabularnewline
35 & -0.126404 & -1.0651 & 0.14522 \tabularnewline
36 & -0.072454 & -0.6105 & 0.271739 \tabularnewline
37 & -0.073109 & -0.616 & 0.269923 \tabularnewline
38 & -0.027008 & -0.2276 & 0.410317 \tabularnewline
39 & -0.016733 & -0.141 & 0.444138 \tabularnewline
40 & -0.113871 & -0.9595 & 0.170283 \tabularnewline
41 & -0.025664 & -0.2163 & 0.414706 \tabularnewline
42 & -0.093842 & -0.7907 & 0.215868 \tabularnewline
43 & -0.022332 & -0.1882 & 0.425638 \tabularnewline
44 & -0.02962 & -0.2496 & 0.401817 \tabularnewline
45 & -0.011198 & -0.0944 & 0.462544 \tabularnewline
46 & -0.043755 & -0.3687 & 0.356729 \tabularnewline
47 & 0.072583 & 0.6116 & 0.27138 \tabularnewline
48 & -0.000676 & -0.0057 & 0.497737 \tabularnewline
\hline
\end{tabular}
%Source: https://freestatistics.org/blog/index.php?pk=&T=2

[TABLE]
[ROW][C]Partial Autocorrelation Function[/C][/ROW]
[ROW][C]Time lag k[/C][C]PACF(k)[/C][C]T-STAT[/C][C]P-value[/C][/ROW]
[ROW][C]1[/C][C]0.516995[/C][C]4.3563[/C][C]2.2e-05[/C][/ROW]
[ROW][C]2[/C][C]-0.388899[/C][C]-3.2769[/C][C]0.000813[/C][/ROW]
[ROW][C]3[/C][C]0.052249[/C][C]0.4403[/C][C]0.330545[/C][/ROW]
[ROW][C]4[/C][C]-0.132112[/C][C]-1.1132[/C][C]0.13469[/C][/ROW]
[ROW][C]5[/C][C]-0.056746[/C][C]-0.4782[/C][C]0.317006[/C][/ROW]
[ROW][C]6[/C][C]-0.012894[/C][C]-0.1086[/C][C]0.456894[/C][/ROW]
[ROW][C]7[/C][C]-0.17936[/C][C]-1.5113[/C][C]0.067574[/C][/ROW]
[ROW][C]8[/C][C]-0.174881[/C][C]-1.4736[/C][C]0.072508[/C][/ROW]
[ROW][C]9[/C][C]-0.119571[/C][C]-1.0075[/C][C]0.158552[/C][/ROW]
[ROW][C]10[/C][C]0.065328[/C][C]0.5505[/C][C]0.291864[/C][/ROW]
[ROW][C]11[/C][C]0.293263[/C][C]2.4711[/C][C]0.007936[/C][/ROW]
[ROW][C]12[/C][C]0.004372[/C][C]0.0368[/C][C]0.485358[/C][/ROW]
[ROW][C]13[/C][C]-0.229319[/C][C]-1.9323[/C][C]0.028658[/C][/ROW]
[ROW][C]14[/C][C]0.025029[/C][C]0.2109[/C][C]0.416785[/C][/ROW]
[ROW][C]15[/C][C]-0.035565[/C][C]-0.2997[/C][C]0.38265[/C][/ROW]
[ROW][C]16[/C][C]0.085121[/C][C]0.7172[/C][C]0.237788[/C][/ROW]
[ROW][C]17[/C][C]-0.127657[/C][C]-1.0757[/C][C]0.142862[/C][/ROW]
[ROW][C]18[/C][C]0.087829[/C][C]0.7401[/C][C]0.230851[/C][/ROW]
[ROW][C]19[/C][C]-0.145316[/C][C]-1.2245[/C][C]0.112415[/C][/ROW]
[ROW][C]20[/C][C]0.16403[/C][C]1.3821[/C][C]0.08563[/C][/ROW]
[ROW][C]21[/C][C]0.175591[/C][C]1.4796[/C][C]0.071708[/C][/ROW]
[ROW][C]22[/C][C]0.034377[/C][C]0.2897[/C][C]0.386458[/C][/ROW]
[ROW][C]23[/C][C]-0.096194[/C][C]-0.8105[/C][C]0.210168[/C][/ROW]
[ROW][C]24[/C][C]0.008045[/C][C]0.0678[/C][C]0.473073[/C][/ROW]
[ROW][C]25[/C][C]0.055361[/C][C]0.4665[/C][C]0.321151[/C][/ROW]
[ROW][C]26[/C][C]0.003859[/C][C]0.0325[/C][C]0.487075[/C][/ROW]
[ROW][C]27[/C][C]-0.090441[/C][C]-0.7621[/C][C]0.224273[/C][/ROW]
[ROW][C]28[/C][C]-0.150464[/C][C]-1.2678[/C][C]0.1045[/C][/ROW]
[ROW][C]29[/C][C]0.117127[/C][C]0.9869[/C][C]0.163515[/C][/ROW]
[ROW][C]30[/C][C]0.017016[/C][C]0.1434[/C][C]0.443197[/C][/ROW]
[ROW][C]31[/C][C]0.053502[/C][C]0.4508[/C][C]0.326748[/C][/ROW]
[ROW][C]32[/C][C]-0.0976[/C][C]-0.8224[/C][C]0.206804[/C][/ROW]
[ROW][C]33[/C][C]0.02773[/C][C]0.2337[/C][C]0.407963[/C][/ROW]
[ROW][C]34[/C][C]-0.045724[/C][C]-0.3853[/C][C]0.350592[/C][/ROW]
[ROW][C]35[/C][C]-0.126404[/C][C]-1.0651[/C][C]0.14522[/C][/ROW]
[ROW][C]36[/C][C]-0.072454[/C][C]-0.6105[/C][C]0.271739[/C][/ROW]
[ROW][C]37[/C][C]-0.073109[/C][C]-0.616[/C][C]0.269923[/C][/ROW]
[ROW][C]38[/C][C]-0.027008[/C][C]-0.2276[/C][C]0.410317[/C][/ROW]
[ROW][C]39[/C][C]-0.016733[/C][C]-0.141[/C][C]0.444138[/C][/ROW]
[ROW][C]40[/C][C]-0.113871[/C][C]-0.9595[/C][C]0.170283[/C][/ROW]
[ROW][C]41[/C][C]-0.025664[/C][C]-0.2163[/C][C]0.414706[/C][/ROW]
[ROW][C]42[/C][C]-0.093842[/C][C]-0.7907[/C][C]0.215868[/C][/ROW]
[ROW][C]43[/C][C]-0.022332[/C][C]-0.1882[/C][C]0.425638[/C][/ROW]
[ROW][C]44[/C][C]-0.02962[/C][C]-0.2496[/C][C]0.401817[/C][/ROW]
[ROW][C]45[/C][C]-0.011198[/C][C]-0.0944[/C][C]0.462544[/C][/ROW]
[ROW][C]46[/C][C]-0.043755[/C][C]-0.3687[/C][C]0.356729[/C][/ROW]
[ROW][C]47[/C][C]0.072583[/C][C]0.6116[/C][C]0.27138[/C][/ROW]
[ROW][C]48[/C][C]-0.000676[/C][C]-0.0057[/C][C]0.497737[/C][/ROW]
[/TABLE]
Source: https://freestatistics.org/blog/index.php?pk=&T=2

Globally Unique Identifier (entire table): ba.freestatistics.org/blog/index.php?pk=&T=2

As an alternative you can also use a QR Code:  

The GUIDs for individual cells are displayed in the table below:

Partial Autocorrelation Function
Time lag kPACF(k)T-STATP-value
10.5169954.35632.2e-05
2-0.388899-3.27690.000813
30.0522490.44030.330545
4-0.132112-1.11320.13469
5-0.056746-0.47820.317006
6-0.012894-0.10860.456894
7-0.17936-1.51130.067574
8-0.174881-1.47360.072508
9-0.119571-1.00750.158552
100.0653280.55050.291864
110.2932632.47110.007936
120.0043720.03680.485358
13-0.229319-1.93230.028658
140.0250290.21090.416785
15-0.035565-0.29970.38265
160.0851210.71720.237788
17-0.127657-1.07570.142862
180.0878290.74010.230851
19-0.145316-1.22450.112415
200.164031.38210.08563
210.1755911.47960.071708
220.0343770.28970.386458
23-0.096194-0.81050.210168
240.0080450.06780.473073
250.0553610.46650.321151
260.0038590.03250.487075
27-0.090441-0.76210.224273
28-0.150464-1.26780.1045
290.1171270.98690.163515
300.0170160.14340.443197
310.0535020.45080.326748
32-0.0976-0.82240.206804
330.027730.23370.407963
34-0.045724-0.38530.350592
35-0.126404-1.06510.14522
36-0.072454-0.61050.271739
37-0.073109-0.6160.269923
38-0.027008-0.22760.410317
39-0.016733-0.1410.444138
40-0.113871-0.95950.170283
41-0.025664-0.21630.414706
42-0.093842-0.79070.215868
43-0.022332-0.18820.425638
44-0.02962-0.24960.401817
45-0.011198-0.09440.462544
46-0.043755-0.36870.356729
470.0725830.61160.27138
48-0.000676-0.00570.497737


Parameters (Session):
par1 = 48 ; par2 = 1 ; par3 = 1 ; par4 = 0 ; par5 = 12 ; par6 = White Noise ; par7 = 0.95 ;
Parameters (R input):
par1 = 48 ; par2 = 1 ; par3 = 1 ; par4 = 0 ; par5 = 12 ; par6 = White Noise ; par7 = 0.95 ; par8 = ;
R code (references can be found in the software module):
par8 <- ''
par7 <- '0.95'
par6 <- 'White Noise'
par5 <- '12'
par4 <- '0'
par3 <- '0'
par2 <- '1'
par1 <- '48'
if (par1 == 'Default') {
par1 = 10*log10(length(x))
} else {
par1 <- as.numeric(par1)
}
par2 <- as.numeric(par2)
par3 <- as.numeric(par3)
par4 <- as.numeric(par4)
par5 <- as.numeric(par5)
if (par6 == 'White Noise') par6 <- 'white' else par6 <- 'ma'
par7 <- as.numeric(par7)
if (par8 != '') par8 <- as.numeric(par8)
x <- na.omit(x)
ox <- x
if (par8 == '') {
if (par2 == 0) {
x <- log(x)
} else {
x <- (x ^ par2 - 1) / par2
}
} else {
x <- log(x,base=par8)
}
if (par3 > 0) x <- diff(x,lag=1,difference=par3)
if (par4 > 0) x <- diff(x,lag=par5,difference=par4)
bitmap(file='picts.png')
op <- par(mfrow=c(2,1))
plot(ox,type='l',main='Original Time Series',xlab='time',ylab='value')
if (par8=='') {
mytitle <- paste('Working Time Series (lambda=',par2,', d=',par3,', D=',par4,')',sep='')
mysub <- paste('(lambda=',par2,', d=',par3,', D=',par4,', CI=', par7, ', CI type=',par6,')',sep='')
} else {
mytitle <- paste('Working Time Series (base=',par8,', d=',par3,', D=',par4,')',sep='')
mysub <- paste('(base=',par8,', d=',par3,', D=',par4,', CI=', par7, ', CI type=',par6,')',sep='')
}
plot(x,type='l', main=mytitle,xlab='time',ylab='value')
par(op)
dev.off()
bitmap(file='pic1.png')
racf <- acf(x, par1, main='Autocorrelation', xlab='time lag', ylab='ACF', ci.type=par6, ci=par7, sub=mysub)
dev.off()
bitmap(file='pic2.png')
rpacf <- pacf(x,par1,main='Partial Autocorrelation',xlab='lags',ylab='PACF',sub=mysub)
dev.off()
(myacf <- c(racf$acf))
(mypacf <- c(rpacf$acf))
lengthx <- length(x)
sqrtn <- sqrt(lengthx)
load(file='createtable')
a<-table.start()
a<-table.row.start(a)
a<-table.element(a,'Autocorrelation Function',4,TRUE)
a<-table.row.end(a)
a<-table.row.start(a)
a<-table.element(a,'Time lag k',header=TRUE)
a<-table.element(a,hyperlink('basics.htm','ACF(k)','click here for more information about the Autocorrelation Function'),header=TRUE)
a<-table.element(a,'T-STAT',header=TRUE)
a<-table.element(a,'P-value',header=TRUE)
a<-table.row.end(a)
for (i in 2:(par1+1)) {
a<-table.row.start(a)
a<-table.element(a,i-1,header=TRUE)
a<-table.element(a,round(myacf[i],6))
mytstat <- myacf[i]*sqrtn
a<-table.element(a,round(mytstat,4))
a<-table.element(a,round(1-pt(abs(mytstat),lengthx),6))
a<-table.row.end(a)
}
a<-table.end(a)
table.save(a,file='mytable.tab')
a<-table.start()
a<-table.row.start(a)
a<-table.element(a,'Partial Autocorrelation Function',4,TRUE)
a<-table.row.end(a)
a<-table.row.start(a)
a<-table.element(a,'Time lag k',header=TRUE)
a<-table.element(a,hyperlink('basics.htm','PACF(k)','click here for more information about the Partial Autocorrelation Function'),header=TRUE)
a<-table.element(a,'T-STAT',header=TRUE)
a<-table.element(a,'P-value',header=TRUE)
a<-table.row.end(a)
for (i in 1:par1) {
a<-table.row.start(a)
a<-table.element(a,i,header=TRUE)
a<-table.element(a,round(mypacf[i],6))
mytstat <- mypacf[i]*sqrtn
a<-table.element(a,round(mytstat,4))
a<-table.element(a,round(1-pt(abs(mytstat),lengthx),6))
a<-table.row.end(a)
}
a<-table.end(a)
table.save(a,file='mytable1.tab')