Free Statistics

of Irreproducible Research!

Author's title

Author*Unverified author*
R Software Modulerwasp_autocorrelation.wasp
Title produced by software(Partial) Autocorrelation Function
Date of computationFri, 19 May 2017 00:49:10 +0100
Cite this page as followsStatistical Computations at FreeStatistics.org, Office for Research Development and Education, URL https://freestatistics.org/blog/index.php?v=date/2017/May/19/t1495151376pc20qk0lx6g5bwm.htm/, Retrieved Wed, 15 May 2024 21:14:45 +0200
Statistical Computations at FreeStatistics.org, Office for Research Development and Education, URL https://freestatistics.org/blog/index.php?pk=, Retrieved Wed, 15 May 2024 21:14:45 +0200
QR Codes:

Original text written by user:
IsPrivate?No (this computation is public)
User-defined keywords
Estimated Impact0
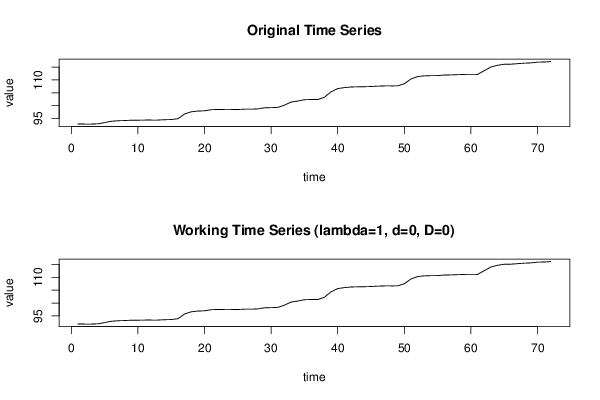
Dataseries X:
92,81
92,82
92,82
92,88
93,38
93,89
94,1
94,18
94,3
94,31
94,36
94,38
94,38
94,5
94,57
94,89
96,71
97,57
97,88
97,97
98,4
98,51
98,46
98,46
98,48
98,6
98,6
98,71
99,13
99,2
99,3
100,18
101,37
101,77
102,28
102,38
102,35
103,23
105,37
106,62
107
107,24
107,31
107,35
107,42
107,58
107,64
107,64
107,68
108,51
110,37
111,31
111,57
111,66
111,69
111,9
111,95
112,04
112,13
112,14
112,13
113,59
115,03
115,7
116,1
116,12
116,32
116,51
116,63
116,92
116,96
117,15


Summary of computational transaction
Raw Inputview raw input (R code)
Raw Outputview raw output of R engine
Computing time2 seconds
R Server'Gwilym Jenkins' @ jenkins.wessa.net

\begin{tabular}{lllllllll}
\hline
Summary of computational transaction \tabularnewline
Raw Input & view raw input (R code)  \tabularnewline
Raw Output & view raw output of R engine  \tabularnewline
Computing time & 2 seconds \tabularnewline
R Server & 'Gwilym Jenkins' @ jenkins.wessa.net \tabularnewline
\hline
\end{tabular}
%Source: https://freestatistics.org/blog/index.php?pk=&T=0

[TABLE]
[ROW][C]Summary of computational transaction[/C][/ROW]
[ROW][C]Raw Input[/C][C]view raw input (R code) [/C][/ROW]
[ROW][C]Raw Output[/C][C]view raw output of R engine [/C][/ROW]
[ROW][C]Computing time[/C][C]2 seconds[/C][/ROW]
[ROW][C]R Server[/C][C]'Gwilym Jenkins' @ jenkins.wessa.net[/C][/ROW]
[/TABLE]
Source: https://freestatistics.org/blog/index.php?pk=&T=0

Globally Unique Identifier (entire table): ba.freestatistics.org/blog/index.php?pk=&T=0

As an alternative you can also use a QR Code:  

The GUIDs for individual cells are displayed in the table below:

Summary of computational transaction
Raw Inputview raw input (R code)
Raw Outputview raw output of R engine
Computing time2 seconds
R Server'Gwilym Jenkins' @ jenkins.wessa.net


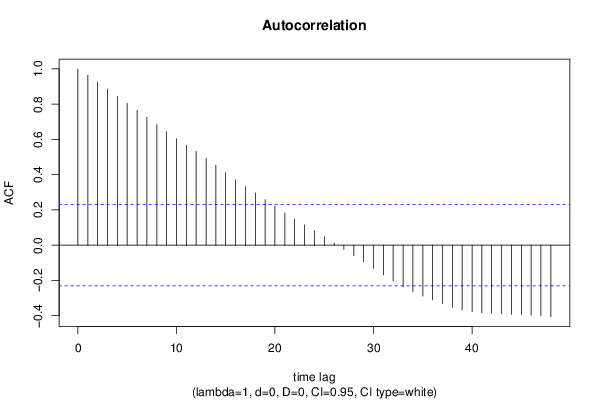
Autocorrelation Function
Time lag kACF(k)T-STATP-value
10.9645338.18430
20.9258827.85640
30.885557.51410
40.8450127.17020
50.8048756.82960
60.7652876.49370
70.7252956.15430
80.6841365.80510
90.6434125.45950
100.6037455.12291e-06
110.5668674.814e-06
120.5315424.51031.2e-05
130.4930324.18354e-05
140.4527793.8420.00013
150.4117273.49360.00041
160.3705583.14430.00121
170.3326272.82240.003079
180.2960182.51180.007127
190.2586332.19460.01571
200.2204251.87040.032749
210.1829851.55270.062442
220.1470481.24770.108084
230.1142540.96950.167776
240.0816240.69260.245394
250.0473530.40180.344508
260.0122160.10370.458867
27-0.023509-0.19950.421226
28-0.059248-0.50270.308342
29-0.09457-0.80250.212465
30-0.130757-1.10950.135451
31-0.167862-1.42440.079331
32-0.203173-1.7240.044501
33-0.235497-1.99830.024733
34-0.264792-2.24680.013859
35-0.288386-2.4470.008423
36-0.310242-2.63250.005183
37-0.3328-2.82390.003066
38-0.353304-2.99790.001865
39-0.367361-3.11720.001312
40-0.377443-3.20270.001014
41-0.383352-3.25280.00087
42-0.386458-3.27920.000803
43-0.389429-3.30440.000743
44-0.392436-3.32990.000686
45-0.394702-3.34920.000646
46-0.397526-3.37316e-04
47-0.401398-3.4060.000541
48-0.405582-3.44150.000483

\begin{tabular}{lllllllll}
\hline
Autocorrelation Function \tabularnewline
Time lag k & ACF(k) & T-STAT & P-value \tabularnewline
1 & 0.964533 & 8.1843 & 0 \tabularnewline
2 & 0.925882 & 7.8564 & 0 \tabularnewline
3 & 0.88555 & 7.5141 & 0 \tabularnewline
4 & 0.845012 & 7.1702 & 0 \tabularnewline
5 & 0.804875 & 6.8296 & 0 \tabularnewline
6 & 0.765287 & 6.4937 & 0 \tabularnewline
7 & 0.725295 & 6.1543 & 0 \tabularnewline
8 & 0.684136 & 5.8051 & 0 \tabularnewline
9 & 0.643412 & 5.4595 & 0 \tabularnewline
10 & 0.603745 & 5.1229 & 1e-06 \tabularnewline
11 & 0.566867 & 4.81 & 4e-06 \tabularnewline
12 & 0.531542 & 4.5103 & 1.2e-05 \tabularnewline
13 & 0.493032 & 4.1835 & 4e-05 \tabularnewline
14 & 0.452779 & 3.842 & 0.00013 \tabularnewline
15 & 0.411727 & 3.4936 & 0.00041 \tabularnewline
16 & 0.370558 & 3.1443 & 0.00121 \tabularnewline
17 & 0.332627 & 2.8224 & 0.003079 \tabularnewline
18 & 0.296018 & 2.5118 & 0.007127 \tabularnewline
19 & 0.258633 & 2.1946 & 0.01571 \tabularnewline
20 & 0.220425 & 1.8704 & 0.032749 \tabularnewline
21 & 0.182985 & 1.5527 & 0.062442 \tabularnewline
22 & 0.147048 & 1.2477 & 0.108084 \tabularnewline
23 & 0.114254 & 0.9695 & 0.167776 \tabularnewline
24 & 0.081624 & 0.6926 & 0.245394 \tabularnewline
25 & 0.047353 & 0.4018 & 0.344508 \tabularnewline
26 & 0.012216 & 0.1037 & 0.458867 \tabularnewline
27 & -0.023509 & -0.1995 & 0.421226 \tabularnewline
28 & -0.059248 & -0.5027 & 0.308342 \tabularnewline
29 & -0.09457 & -0.8025 & 0.212465 \tabularnewline
30 & -0.130757 & -1.1095 & 0.135451 \tabularnewline
31 & -0.167862 & -1.4244 & 0.079331 \tabularnewline
32 & -0.203173 & -1.724 & 0.044501 \tabularnewline
33 & -0.235497 & -1.9983 & 0.024733 \tabularnewline
34 & -0.264792 & -2.2468 & 0.013859 \tabularnewline
35 & -0.288386 & -2.447 & 0.008423 \tabularnewline
36 & -0.310242 & -2.6325 & 0.005183 \tabularnewline
37 & -0.3328 & -2.8239 & 0.003066 \tabularnewline
38 & -0.353304 & -2.9979 & 0.001865 \tabularnewline
39 & -0.367361 & -3.1172 & 0.001312 \tabularnewline
40 & -0.377443 & -3.2027 & 0.001014 \tabularnewline
41 & -0.383352 & -3.2528 & 0.00087 \tabularnewline
42 & -0.386458 & -3.2792 & 0.000803 \tabularnewline
43 & -0.389429 & -3.3044 & 0.000743 \tabularnewline
44 & -0.392436 & -3.3299 & 0.000686 \tabularnewline
45 & -0.394702 & -3.3492 & 0.000646 \tabularnewline
46 & -0.397526 & -3.3731 & 6e-04 \tabularnewline
47 & -0.401398 & -3.406 & 0.000541 \tabularnewline
48 & -0.405582 & -3.4415 & 0.000483 \tabularnewline
\hline
\end{tabular}
%Source: https://freestatistics.org/blog/index.php?pk=&T=1

[TABLE]
[ROW][C]Autocorrelation Function[/C][/ROW]
[ROW][C]Time lag k[/C][C]ACF(k)[/C][C]T-STAT[/C][C]P-value[/C][/ROW]
[ROW][C]1[/C][C]0.964533[/C][C]8.1843[/C][C]0[/C][/ROW]
[ROW][C]2[/C][C]0.925882[/C][C]7.8564[/C][C]0[/C][/ROW]
[ROW][C]3[/C][C]0.88555[/C][C]7.5141[/C][C]0[/C][/ROW]
[ROW][C]4[/C][C]0.845012[/C][C]7.1702[/C][C]0[/C][/ROW]
[ROW][C]5[/C][C]0.804875[/C][C]6.8296[/C][C]0[/C][/ROW]
[ROW][C]6[/C][C]0.765287[/C][C]6.4937[/C][C]0[/C][/ROW]
[ROW][C]7[/C][C]0.725295[/C][C]6.1543[/C][C]0[/C][/ROW]
[ROW][C]8[/C][C]0.684136[/C][C]5.8051[/C][C]0[/C][/ROW]
[ROW][C]9[/C][C]0.643412[/C][C]5.4595[/C][C]0[/C][/ROW]
[ROW][C]10[/C][C]0.603745[/C][C]5.1229[/C][C]1e-06[/C][/ROW]
[ROW][C]11[/C][C]0.566867[/C][C]4.81[/C][C]4e-06[/C][/ROW]
[ROW][C]12[/C][C]0.531542[/C][C]4.5103[/C][C]1.2e-05[/C][/ROW]
[ROW][C]13[/C][C]0.493032[/C][C]4.1835[/C][C]4e-05[/C][/ROW]
[ROW][C]14[/C][C]0.452779[/C][C]3.842[/C][C]0.00013[/C][/ROW]
[ROW][C]15[/C][C]0.411727[/C][C]3.4936[/C][C]0.00041[/C][/ROW]
[ROW][C]16[/C][C]0.370558[/C][C]3.1443[/C][C]0.00121[/C][/ROW]
[ROW][C]17[/C][C]0.332627[/C][C]2.8224[/C][C]0.003079[/C][/ROW]
[ROW][C]18[/C][C]0.296018[/C][C]2.5118[/C][C]0.007127[/C][/ROW]
[ROW][C]19[/C][C]0.258633[/C][C]2.1946[/C][C]0.01571[/C][/ROW]
[ROW][C]20[/C][C]0.220425[/C][C]1.8704[/C][C]0.032749[/C][/ROW]
[ROW][C]21[/C][C]0.182985[/C][C]1.5527[/C][C]0.062442[/C][/ROW]
[ROW][C]22[/C][C]0.147048[/C][C]1.2477[/C][C]0.108084[/C][/ROW]
[ROW][C]23[/C][C]0.114254[/C][C]0.9695[/C][C]0.167776[/C][/ROW]
[ROW][C]24[/C][C]0.081624[/C][C]0.6926[/C][C]0.245394[/C][/ROW]
[ROW][C]25[/C][C]0.047353[/C][C]0.4018[/C][C]0.344508[/C][/ROW]
[ROW][C]26[/C][C]0.012216[/C][C]0.1037[/C][C]0.458867[/C][/ROW]
[ROW][C]27[/C][C]-0.023509[/C][C]-0.1995[/C][C]0.421226[/C][/ROW]
[ROW][C]28[/C][C]-0.059248[/C][C]-0.5027[/C][C]0.308342[/C][/ROW]
[ROW][C]29[/C][C]-0.09457[/C][C]-0.8025[/C][C]0.212465[/C][/ROW]
[ROW][C]30[/C][C]-0.130757[/C][C]-1.1095[/C][C]0.135451[/C][/ROW]
[ROW][C]31[/C][C]-0.167862[/C][C]-1.4244[/C][C]0.079331[/C][/ROW]
[ROW][C]32[/C][C]-0.203173[/C][C]-1.724[/C][C]0.044501[/C][/ROW]
[ROW][C]33[/C][C]-0.235497[/C][C]-1.9983[/C][C]0.024733[/C][/ROW]
[ROW][C]34[/C][C]-0.264792[/C][C]-2.2468[/C][C]0.013859[/C][/ROW]
[ROW][C]35[/C][C]-0.288386[/C][C]-2.447[/C][C]0.008423[/C][/ROW]
[ROW][C]36[/C][C]-0.310242[/C][C]-2.6325[/C][C]0.005183[/C][/ROW]
[ROW][C]37[/C][C]-0.3328[/C][C]-2.8239[/C][C]0.003066[/C][/ROW]
[ROW][C]38[/C][C]-0.353304[/C][C]-2.9979[/C][C]0.001865[/C][/ROW]
[ROW][C]39[/C][C]-0.367361[/C][C]-3.1172[/C][C]0.001312[/C][/ROW]
[ROW][C]40[/C][C]-0.377443[/C][C]-3.2027[/C][C]0.001014[/C][/ROW]
[ROW][C]41[/C][C]-0.383352[/C][C]-3.2528[/C][C]0.00087[/C][/ROW]
[ROW][C]42[/C][C]-0.386458[/C][C]-3.2792[/C][C]0.000803[/C][/ROW]
[ROW][C]43[/C][C]-0.389429[/C][C]-3.3044[/C][C]0.000743[/C][/ROW]
[ROW][C]44[/C][C]-0.392436[/C][C]-3.3299[/C][C]0.000686[/C][/ROW]
[ROW][C]45[/C][C]-0.394702[/C][C]-3.3492[/C][C]0.000646[/C][/ROW]
[ROW][C]46[/C][C]-0.397526[/C][C]-3.3731[/C][C]6e-04[/C][/ROW]
[ROW][C]47[/C][C]-0.401398[/C][C]-3.406[/C][C]0.000541[/C][/ROW]
[ROW][C]48[/C][C]-0.405582[/C][C]-3.4415[/C][C]0.000483[/C][/ROW]
[/TABLE]
Source: https://freestatistics.org/blog/index.php?pk=&T=1

Globally Unique Identifier (entire table): ba.freestatistics.org/blog/index.php?pk=&T=1

As an alternative you can also use a QR Code:  

The GUIDs for individual cells are displayed in the table below:

Autocorrelation Function
Time lag kACF(k)T-STATP-value
10.9645338.18430
20.9258827.85640
30.885557.51410
40.8450127.17020
50.8048756.82960
60.7652876.49370
70.7252956.15430
80.6841365.80510
90.6434125.45950
100.6037455.12291e-06
110.5668674.814e-06
120.5315424.51031.2e-05
130.4930324.18354e-05
140.4527793.8420.00013
150.4117273.49360.00041
160.3705583.14430.00121
170.3326272.82240.003079
180.2960182.51180.007127
190.2586332.19460.01571
200.2204251.87040.032749
210.1829851.55270.062442
220.1470481.24770.108084
230.1142540.96950.167776
240.0816240.69260.245394
250.0473530.40180.344508
260.0122160.10370.458867
27-0.023509-0.19950.421226
28-0.059248-0.50270.308342
29-0.09457-0.80250.212465
30-0.130757-1.10950.135451
31-0.167862-1.42440.079331
32-0.203173-1.7240.044501
33-0.235497-1.99830.024733
34-0.264792-2.24680.013859
35-0.288386-2.4470.008423
36-0.310242-2.63250.005183
37-0.3328-2.82390.003066
38-0.353304-2.99790.001865
39-0.367361-3.11720.001312
40-0.377443-3.20270.001014
41-0.383352-3.25280.00087
42-0.386458-3.27920.000803
43-0.389429-3.30440.000743
44-0.392436-3.32990.000686
45-0.394702-3.34920.000646
46-0.397526-3.37316e-04
47-0.401398-3.4060.000541
48-0.405582-3.44150.000483


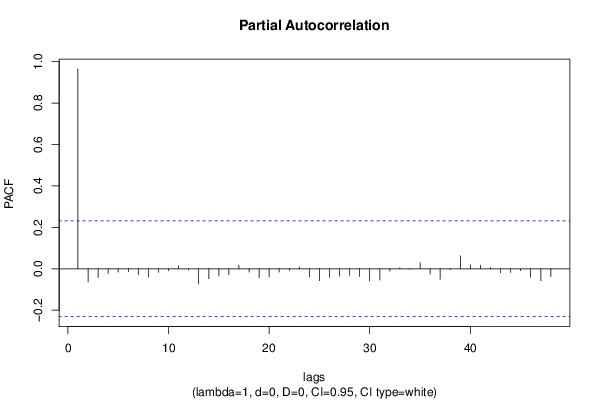
Partial Autocorrelation Function
Time lag kPACF(k)T-STATP-value
10.9645338.18430
2-0.063744-0.54090.295128
3-0.042324-0.35910.360273
4-0.022392-0.190.42492
5-0.015531-0.13180.44776
6-0.014728-0.1250.450448
7-0.029165-0.24750.402622
8-0.039925-0.33880.367884
9-0.016474-0.13980.444609
10-0.009216-0.07820.468943
110.0141670.12020.452327
12-0.005359-0.04550.481929
13-0.073027-0.61970.26872
14-0.04801-0.40740.342468
15-0.034553-0.29320.385111
16-0.028154-0.23890.405932
170.0169620.14390.44298
18-0.015205-0.1290.448852
19-0.043322-0.36760.357125
20-0.039099-0.33180.370516
21-0.015977-0.13560.446269
22-0.008461-0.07180.471481
230.0085470.07250.471194
24-0.038189-0.3240.373421
25-0.057018-0.48380.314992
26-0.040817-0.34630.365047
27-0.035524-0.30140.381977
28-0.031869-0.27040.393808
29-0.03715-0.31520.376752
30-0.059061-0.50110.308897
31-0.054202-0.45990.323479
32-0.011406-0.09680.461583
330.0050330.04270.483026
34-0.00148-0.01260.495008
350.0293060.24870.402162
36-0.025675-0.21790.414078
37-0.050653-0.42980.33431
38-0.003718-0.03150.487459
390.0624980.53030.298764
400.0188370.15980.436727
410.0173840.14750.441573
420.0058010.04920.480439
43-0.019549-0.16590.434357
44-0.017389-0.14760.441553
45-0.008852-0.07510.470168
46-0.040427-0.3430.366287
47-0.058105-0.4930.311744
48-0.037055-0.31440.377056

\begin{tabular}{lllllllll}
\hline
Partial Autocorrelation Function \tabularnewline
Time lag k & PACF(k) & T-STAT & P-value \tabularnewline
1 & 0.964533 & 8.1843 & 0 \tabularnewline
2 & -0.063744 & -0.5409 & 0.295128 \tabularnewline
3 & -0.042324 & -0.3591 & 0.360273 \tabularnewline
4 & -0.022392 & -0.19 & 0.42492 \tabularnewline
5 & -0.015531 & -0.1318 & 0.44776 \tabularnewline
6 & -0.014728 & -0.125 & 0.450448 \tabularnewline
7 & -0.029165 & -0.2475 & 0.402622 \tabularnewline
8 & -0.039925 & -0.3388 & 0.367884 \tabularnewline
9 & -0.016474 & -0.1398 & 0.444609 \tabularnewline
10 & -0.009216 & -0.0782 & 0.468943 \tabularnewline
11 & 0.014167 & 0.1202 & 0.452327 \tabularnewline
12 & -0.005359 & -0.0455 & 0.481929 \tabularnewline
13 & -0.073027 & -0.6197 & 0.26872 \tabularnewline
14 & -0.04801 & -0.4074 & 0.342468 \tabularnewline
15 & -0.034553 & -0.2932 & 0.385111 \tabularnewline
16 & -0.028154 & -0.2389 & 0.405932 \tabularnewline
17 & 0.016962 & 0.1439 & 0.44298 \tabularnewline
18 & -0.015205 & -0.129 & 0.448852 \tabularnewline
19 & -0.043322 & -0.3676 & 0.357125 \tabularnewline
20 & -0.039099 & -0.3318 & 0.370516 \tabularnewline
21 & -0.015977 & -0.1356 & 0.446269 \tabularnewline
22 & -0.008461 & -0.0718 & 0.471481 \tabularnewline
23 & 0.008547 & 0.0725 & 0.471194 \tabularnewline
24 & -0.038189 & -0.324 & 0.373421 \tabularnewline
25 & -0.057018 & -0.4838 & 0.314992 \tabularnewline
26 & -0.040817 & -0.3463 & 0.365047 \tabularnewline
27 & -0.035524 & -0.3014 & 0.381977 \tabularnewline
28 & -0.031869 & -0.2704 & 0.393808 \tabularnewline
29 & -0.03715 & -0.3152 & 0.376752 \tabularnewline
30 & -0.059061 & -0.5011 & 0.308897 \tabularnewline
31 & -0.054202 & -0.4599 & 0.323479 \tabularnewline
32 & -0.011406 & -0.0968 & 0.461583 \tabularnewline
33 & 0.005033 & 0.0427 & 0.483026 \tabularnewline
34 & -0.00148 & -0.0126 & 0.495008 \tabularnewline
35 & 0.029306 & 0.2487 & 0.402162 \tabularnewline
36 & -0.025675 & -0.2179 & 0.414078 \tabularnewline
37 & -0.050653 & -0.4298 & 0.33431 \tabularnewline
38 & -0.003718 & -0.0315 & 0.487459 \tabularnewline
39 & 0.062498 & 0.5303 & 0.298764 \tabularnewline
40 & 0.018837 & 0.1598 & 0.436727 \tabularnewline
41 & 0.017384 & 0.1475 & 0.441573 \tabularnewline
42 & 0.005801 & 0.0492 & 0.480439 \tabularnewline
43 & -0.019549 & -0.1659 & 0.434357 \tabularnewline
44 & -0.017389 & -0.1476 & 0.441553 \tabularnewline
45 & -0.008852 & -0.0751 & 0.470168 \tabularnewline
46 & -0.040427 & -0.343 & 0.366287 \tabularnewline
47 & -0.058105 & -0.493 & 0.311744 \tabularnewline
48 & -0.037055 & -0.3144 & 0.377056 \tabularnewline
\hline
\end{tabular}
%Source: https://freestatistics.org/blog/index.php?pk=&T=2

[TABLE]
[ROW][C]Partial Autocorrelation Function[/C][/ROW]
[ROW][C]Time lag k[/C][C]PACF(k)[/C][C]T-STAT[/C][C]P-value[/C][/ROW]
[ROW][C]1[/C][C]0.964533[/C][C]8.1843[/C][C]0[/C][/ROW]
[ROW][C]2[/C][C]-0.063744[/C][C]-0.5409[/C][C]0.295128[/C][/ROW]
[ROW][C]3[/C][C]-0.042324[/C][C]-0.3591[/C][C]0.360273[/C][/ROW]
[ROW][C]4[/C][C]-0.022392[/C][C]-0.19[/C][C]0.42492[/C][/ROW]
[ROW][C]5[/C][C]-0.015531[/C][C]-0.1318[/C][C]0.44776[/C][/ROW]
[ROW][C]6[/C][C]-0.014728[/C][C]-0.125[/C][C]0.450448[/C][/ROW]
[ROW][C]7[/C][C]-0.029165[/C][C]-0.2475[/C][C]0.402622[/C][/ROW]
[ROW][C]8[/C][C]-0.039925[/C][C]-0.3388[/C][C]0.367884[/C][/ROW]
[ROW][C]9[/C][C]-0.016474[/C][C]-0.1398[/C][C]0.444609[/C][/ROW]
[ROW][C]10[/C][C]-0.009216[/C][C]-0.0782[/C][C]0.468943[/C][/ROW]
[ROW][C]11[/C][C]0.014167[/C][C]0.1202[/C][C]0.452327[/C][/ROW]
[ROW][C]12[/C][C]-0.005359[/C][C]-0.0455[/C][C]0.481929[/C][/ROW]
[ROW][C]13[/C][C]-0.073027[/C][C]-0.6197[/C][C]0.26872[/C][/ROW]
[ROW][C]14[/C][C]-0.04801[/C][C]-0.4074[/C][C]0.342468[/C][/ROW]
[ROW][C]15[/C][C]-0.034553[/C][C]-0.2932[/C][C]0.385111[/C][/ROW]
[ROW][C]16[/C][C]-0.028154[/C][C]-0.2389[/C][C]0.405932[/C][/ROW]
[ROW][C]17[/C][C]0.016962[/C][C]0.1439[/C][C]0.44298[/C][/ROW]
[ROW][C]18[/C][C]-0.015205[/C][C]-0.129[/C][C]0.448852[/C][/ROW]
[ROW][C]19[/C][C]-0.043322[/C][C]-0.3676[/C][C]0.357125[/C][/ROW]
[ROW][C]20[/C][C]-0.039099[/C][C]-0.3318[/C][C]0.370516[/C][/ROW]
[ROW][C]21[/C][C]-0.015977[/C][C]-0.1356[/C][C]0.446269[/C][/ROW]
[ROW][C]22[/C][C]-0.008461[/C][C]-0.0718[/C][C]0.471481[/C][/ROW]
[ROW][C]23[/C][C]0.008547[/C][C]0.0725[/C][C]0.471194[/C][/ROW]
[ROW][C]24[/C][C]-0.038189[/C][C]-0.324[/C][C]0.373421[/C][/ROW]
[ROW][C]25[/C][C]-0.057018[/C][C]-0.4838[/C][C]0.314992[/C][/ROW]
[ROW][C]26[/C][C]-0.040817[/C][C]-0.3463[/C][C]0.365047[/C][/ROW]
[ROW][C]27[/C][C]-0.035524[/C][C]-0.3014[/C][C]0.381977[/C][/ROW]
[ROW][C]28[/C][C]-0.031869[/C][C]-0.2704[/C][C]0.393808[/C][/ROW]
[ROW][C]29[/C][C]-0.03715[/C][C]-0.3152[/C][C]0.376752[/C][/ROW]
[ROW][C]30[/C][C]-0.059061[/C][C]-0.5011[/C][C]0.308897[/C][/ROW]
[ROW][C]31[/C][C]-0.054202[/C][C]-0.4599[/C][C]0.323479[/C][/ROW]
[ROW][C]32[/C][C]-0.011406[/C][C]-0.0968[/C][C]0.461583[/C][/ROW]
[ROW][C]33[/C][C]0.005033[/C][C]0.0427[/C][C]0.483026[/C][/ROW]
[ROW][C]34[/C][C]-0.00148[/C][C]-0.0126[/C][C]0.495008[/C][/ROW]
[ROW][C]35[/C][C]0.029306[/C][C]0.2487[/C][C]0.402162[/C][/ROW]
[ROW][C]36[/C][C]-0.025675[/C][C]-0.2179[/C][C]0.414078[/C][/ROW]
[ROW][C]37[/C][C]-0.050653[/C][C]-0.4298[/C][C]0.33431[/C][/ROW]
[ROW][C]38[/C][C]-0.003718[/C][C]-0.0315[/C][C]0.487459[/C][/ROW]
[ROW][C]39[/C][C]0.062498[/C][C]0.5303[/C][C]0.298764[/C][/ROW]
[ROW][C]40[/C][C]0.018837[/C][C]0.1598[/C][C]0.436727[/C][/ROW]
[ROW][C]41[/C][C]0.017384[/C][C]0.1475[/C][C]0.441573[/C][/ROW]
[ROW][C]42[/C][C]0.005801[/C][C]0.0492[/C][C]0.480439[/C][/ROW]
[ROW][C]43[/C][C]-0.019549[/C][C]-0.1659[/C][C]0.434357[/C][/ROW]
[ROW][C]44[/C][C]-0.017389[/C][C]-0.1476[/C][C]0.441553[/C][/ROW]
[ROW][C]45[/C][C]-0.008852[/C][C]-0.0751[/C][C]0.470168[/C][/ROW]
[ROW][C]46[/C][C]-0.040427[/C][C]-0.343[/C][C]0.366287[/C][/ROW]
[ROW][C]47[/C][C]-0.058105[/C][C]-0.493[/C][C]0.311744[/C][/ROW]
[ROW][C]48[/C][C]-0.037055[/C][C]-0.3144[/C][C]0.377056[/C][/ROW]
[/TABLE]
Source: https://freestatistics.org/blog/index.php?pk=&T=2

Globally Unique Identifier (entire table): ba.freestatistics.org/blog/index.php?pk=&T=2

As an alternative you can also use a QR Code:  

The GUIDs for individual cells are displayed in the table below:

Partial Autocorrelation Function
Time lag kPACF(k)T-STATP-value
10.9645338.18430
2-0.063744-0.54090.295128
3-0.042324-0.35910.360273
4-0.022392-0.190.42492
5-0.015531-0.13180.44776
6-0.014728-0.1250.450448
7-0.029165-0.24750.402622
8-0.039925-0.33880.367884
9-0.016474-0.13980.444609
10-0.009216-0.07820.468943
110.0141670.12020.452327
12-0.005359-0.04550.481929
13-0.073027-0.61970.26872
14-0.04801-0.40740.342468
15-0.034553-0.29320.385111
16-0.028154-0.23890.405932
170.0169620.14390.44298
18-0.015205-0.1290.448852
19-0.043322-0.36760.357125
20-0.039099-0.33180.370516
21-0.015977-0.13560.446269
22-0.008461-0.07180.471481
230.0085470.07250.471194
24-0.038189-0.3240.373421
25-0.057018-0.48380.314992
26-0.040817-0.34630.365047
27-0.035524-0.30140.381977
28-0.031869-0.27040.393808
29-0.03715-0.31520.376752
30-0.059061-0.50110.308897
31-0.054202-0.45990.323479
32-0.011406-0.09680.461583
330.0050330.04270.483026
34-0.00148-0.01260.495008
350.0293060.24870.402162
36-0.025675-0.21790.414078
37-0.050653-0.42980.33431
38-0.003718-0.03150.487459
390.0624980.53030.298764
400.0188370.15980.436727
410.0173840.14750.441573
420.0058010.04920.480439
43-0.019549-0.16590.434357
44-0.017389-0.14760.441553
45-0.008852-0.07510.470168
46-0.040427-0.3430.366287
47-0.058105-0.4930.311744
48-0.037055-0.31440.377056


Parameters (Session):
par1 = 48 ; par2 = 1 ; par3 = 0 ; par4 = 0 ; par5 = 12 ; par6 = White Noise ; par7 = 0.95 ;
Parameters (R input):
par1 = 48 ; par2 = 1 ; par3 = 0 ; par4 = 0 ; par5 = 12 ; par6 = White Noise ; par7 = 0.95 ; par8 = ;
R code (references can be found in the software module):
if (par1 == 'Default') {
par1 = 10*log10(length(x))
} else {
par1 <- as.numeric(par1)
}
par2 <- as.numeric(par2)
par3 <- as.numeric(par3)
par4 <- as.numeric(par4)
par5 <- as.numeric(par5)
if (par6 == 'White Noise') par6 <- 'white' else par6 <- 'ma'
par7 <- as.numeric(par7)
if (par8 != '') par8 <- as.numeric(par8)
x <- na.omit(x)
ox <- x
if (par8 == '') {
if (par2 == 0) {
x <- log(x)
} else {
x <- (x ^ par2 - 1) / par2
}
} else {
x <- log(x,base=par8)
}
if (par3 > 0) x <- diff(x,lag=1,difference=par3)
if (par4 > 0) x <- diff(x,lag=par5,difference=par4)
bitmap(file='picts.png')
op <- par(mfrow=c(2,1))
plot(ox,type='l',main='Original Time Series',xlab='time',ylab='value')
if (par8=='') {
mytitle <- paste('Working Time Series (lambda=',par2,', d=',par3,', D=',par4,')',sep='')
mysub <- paste('(lambda=',par2,', d=',par3,', D=',par4,', CI=', par7, ', CI type=',par6,')',sep='')
} else {
mytitle <- paste('Working Time Series (base=',par8,', d=',par3,', D=',par4,')',sep='')
mysub <- paste('(base=',par8,', d=',par3,', D=',par4,', CI=', par7, ', CI type=',par6,')',sep='')
}
plot(x,type='l', main=mytitle,xlab='time',ylab='value')
par(op)
dev.off()
bitmap(file='pic1.png')
racf <- acf(x, par1, main='Autocorrelation', xlab='time lag', ylab='ACF', ci.type=par6, ci=par7, sub=mysub)
dev.off()
bitmap(file='pic2.png')
rpacf <- pacf(x,par1,main='Partial Autocorrelation',xlab='lags',ylab='PACF',sub=mysub)
dev.off()
(myacf <- c(racf$acf))
(mypacf <- c(rpacf$acf))
lengthx <- length(x)
sqrtn <- sqrt(lengthx)
load(file='createtable')
a<-table.start()
a<-table.row.start(a)
a<-table.element(a,'Autocorrelation Function',4,TRUE)
a<-table.row.end(a)
a<-table.row.start(a)
a<-table.element(a,'Time lag k',header=TRUE)
a<-table.element(a,hyperlink('basics.htm','ACF(k)','click here for more information about the Autocorrelation Function'),header=TRUE)
a<-table.element(a,'T-STAT',header=TRUE)
a<-table.element(a,'P-value',header=TRUE)
a<-table.row.end(a)
for (i in 2:(par1+1)) {
a<-table.row.start(a)
a<-table.element(a,i-1,header=TRUE)
a<-table.element(a,round(myacf[i],6))
mytstat <- myacf[i]*sqrtn
a<-table.element(a,round(mytstat,4))
a<-table.element(a,round(1-pt(abs(mytstat),lengthx),6))
a<-table.row.end(a)
}
a<-table.end(a)
table.save(a,file='mytable.tab')
a<-table.start()
a<-table.row.start(a)
a<-table.element(a,'Partial Autocorrelation Function',4,TRUE)
a<-table.row.end(a)
a<-table.row.start(a)
a<-table.element(a,'Time lag k',header=TRUE)
a<-table.element(a,hyperlink('basics.htm','PACF(k)','click here for more information about the Partial Autocorrelation Function'),header=TRUE)
a<-table.element(a,'T-STAT',header=TRUE)
a<-table.element(a,'P-value',header=TRUE)
a<-table.row.end(a)
for (i in 1:par1) {
a<-table.row.start(a)
a<-table.element(a,i,header=TRUE)
a<-table.element(a,round(mypacf[i],6))
mytstat <- mypacf[i]*sqrtn
a<-table.element(a,round(mytstat,4))
a<-table.element(a,round(1-pt(abs(mytstat),lengthx),6))
a<-table.row.end(a)
}
a<-table.end(a)
table.save(a,file='mytable1.tab')