Free Statistics

of Irreproducible Research!

Author's title

Author*Unverified author*
R Software Modulerwasp_autocorrelation.wasp
Title produced by software(Partial) Autocorrelation Function
Date of computationThu, 18 May 2017 15:45:57 +0100
Cite this page as followsStatistical Computations at FreeStatistics.org, Office for Research Development and Education, URL https://freestatistics.org/blog/index.php?v=date/2017/May/18/t14951187973uau3nbryuz7crx.htm/, Retrieved Fri, 17 May 2024 05:04:50 +0200
Statistical Computations at FreeStatistics.org, Office for Research Development and Education, URL https://freestatistics.org/blog/index.php?pk=, Retrieved Fri, 17 May 2024 05:04:50 +0200
QR Codes:

Original text written by user:
IsPrivate?No (this computation is public)
User-defined keywords
Estimated Impact0
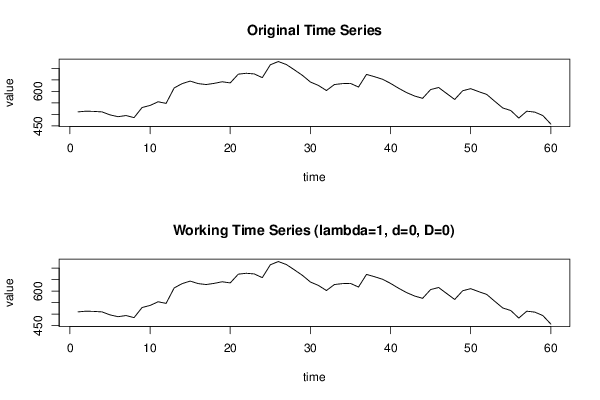
Dataseries X:
511
514
513
511
498
490
495
486
530
539
555
548
615
634
645
634
630
635
642
637
675
679
676
660
716
730
717
694
670
641
626
604
630
634
635
619
674
664
653
635
614
595
580
570
608
617
591
565
603
612
599
587
557
528
517
484
514
510
495
458


Summary of computational transaction
Raw Inputview raw input (R code)
Raw Outputview raw output of R engine
Computing time3 seconds
R Server'Herman Ole Andreas Wold' @ wold.wessa.net

\begin{tabular}{lllllllll}
\hline
Summary of computational transaction \tabularnewline
Raw Input & view raw input (R code)  \tabularnewline
Raw Output & view raw output of R engine  \tabularnewline
Computing time & 3 seconds \tabularnewline
R Server & 'Herman Ole Andreas Wold' @ wold.wessa.net \tabularnewline
\hline
\end{tabular}
%Source: https://freestatistics.org/blog/index.php?pk=&T=0

[TABLE]
[ROW][C]Summary of computational transaction[/C][/ROW]
[ROW][C]Raw Input[/C][C]view raw input (R code) [/C][/ROW]
[ROW][C]Raw Output[/C][C]view raw output of R engine [/C][/ROW]
[ROW][C]Computing time[/C][C]3 seconds[/C][/ROW]
[ROW][C]R Server[/C][C]'Herman Ole Andreas Wold' @ wold.wessa.net[/C][/ROW]
[/TABLE]
Source: https://freestatistics.org/blog/index.php?pk=&T=0

Globally Unique Identifier (entire table): ba.freestatistics.org/blog/index.php?pk=&T=0

As an alternative you can also use a QR Code:  

The GUIDs for individual cells are displayed in the table below:

Summary of computational transaction
Raw Inputview raw input (R code)
Raw Outputview raw output of R engine
Computing time3 seconds
R Server'Herman Ole Andreas Wold' @ wold.wessa.net


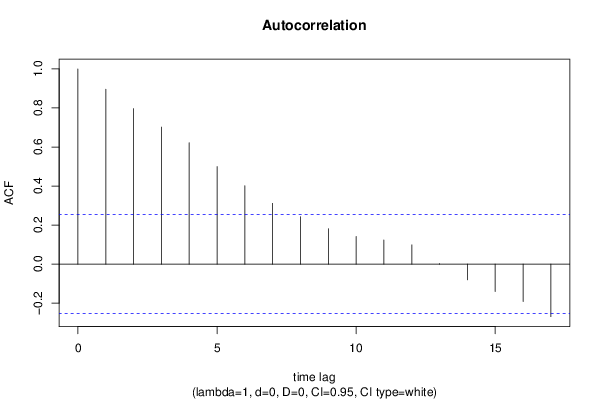
Autocorrelation Function
Time lag kACF(k)T-STATP-value
10.8957186.93820
20.7968416.17230
30.7018595.43661e-06
40.6220334.81825e-06
50.4995873.86980.000136
60.4016233.1110.001427
70.3113282.41150.009481
80.2424671.87810.032612
90.1813111.40440.082673
100.1415381.09630.138654
110.123310.95520.171667
120.0988190.76540.223503
130.0025450.01970.492168
14-0.080575-0.62410.267453
15-0.140328-1.0870.140698
16-0.191353-1.48220.071758
17-0.269151-2.08480.020674

\begin{tabular}{lllllllll}
\hline
Autocorrelation Function \tabularnewline
Time lag k & ACF(k) & T-STAT & P-value \tabularnewline
1 & 0.895718 & 6.9382 & 0 \tabularnewline
2 & 0.796841 & 6.1723 & 0 \tabularnewline
3 & 0.701859 & 5.4366 & 1e-06 \tabularnewline
4 & 0.622033 & 4.8182 & 5e-06 \tabularnewline
5 & 0.499587 & 3.8698 & 0.000136 \tabularnewline
6 & 0.401623 & 3.111 & 0.001427 \tabularnewline
7 & 0.311328 & 2.4115 & 0.009481 \tabularnewline
8 & 0.242467 & 1.8781 & 0.032612 \tabularnewline
9 & 0.181311 & 1.4044 & 0.082673 \tabularnewline
10 & 0.141538 & 1.0963 & 0.138654 \tabularnewline
11 & 0.12331 & 0.9552 & 0.171667 \tabularnewline
12 & 0.098819 & 0.7654 & 0.223503 \tabularnewline
13 & 0.002545 & 0.0197 & 0.492168 \tabularnewline
14 & -0.080575 & -0.6241 & 0.267453 \tabularnewline
15 & -0.140328 & -1.087 & 0.140698 \tabularnewline
16 & -0.191353 & -1.4822 & 0.071758 \tabularnewline
17 & -0.269151 & -2.0848 & 0.020674 \tabularnewline
\hline
\end{tabular}
%Source: https://freestatistics.org/blog/index.php?pk=&T=1

[TABLE]
[ROW][C]Autocorrelation Function[/C][/ROW]
[ROW][C]Time lag k[/C][C]ACF(k)[/C][C]T-STAT[/C][C]P-value[/C][/ROW]
[ROW][C]1[/C][C]0.895718[/C][C]6.9382[/C][C]0[/C][/ROW]
[ROW][C]2[/C][C]0.796841[/C][C]6.1723[/C][C]0[/C][/ROW]
[ROW][C]3[/C][C]0.701859[/C][C]5.4366[/C][C]1e-06[/C][/ROW]
[ROW][C]4[/C][C]0.622033[/C][C]4.8182[/C][C]5e-06[/C][/ROW]
[ROW][C]5[/C][C]0.499587[/C][C]3.8698[/C][C]0.000136[/C][/ROW]
[ROW][C]6[/C][C]0.401623[/C][C]3.111[/C][C]0.001427[/C][/ROW]
[ROW][C]7[/C][C]0.311328[/C][C]2.4115[/C][C]0.009481[/C][/ROW]
[ROW][C]8[/C][C]0.242467[/C][C]1.8781[/C][C]0.032612[/C][/ROW]
[ROW][C]9[/C][C]0.181311[/C][C]1.4044[/C][C]0.082673[/C][/ROW]
[ROW][C]10[/C][C]0.141538[/C][C]1.0963[/C][C]0.138654[/C][/ROW]
[ROW][C]11[/C][C]0.12331[/C][C]0.9552[/C][C]0.171667[/C][/ROW]
[ROW][C]12[/C][C]0.098819[/C][C]0.7654[/C][C]0.223503[/C][/ROW]
[ROW][C]13[/C][C]0.002545[/C][C]0.0197[/C][C]0.492168[/C][/ROW]
[ROW][C]14[/C][C]-0.080575[/C][C]-0.6241[/C][C]0.267453[/C][/ROW]
[ROW][C]15[/C][C]-0.140328[/C][C]-1.087[/C][C]0.140698[/C][/ROW]
[ROW][C]16[/C][C]-0.191353[/C][C]-1.4822[/C][C]0.071758[/C][/ROW]
[ROW][C]17[/C][C]-0.269151[/C][C]-2.0848[/C][C]0.020674[/C][/ROW]
[/TABLE]
Source: https://freestatistics.org/blog/index.php?pk=&T=1

Globally Unique Identifier (entire table): ba.freestatistics.org/blog/index.php?pk=&T=1

As an alternative you can also use a QR Code:  

The GUIDs for individual cells are displayed in the table below:

Autocorrelation Function
Time lag kACF(k)T-STATP-value
10.8957186.93820
20.7968416.17230
30.7018595.43661e-06
40.6220334.81825e-06
50.4995873.86980.000136
60.4016233.1110.001427
70.3113282.41150.009481
80.2424671.87810.032612
90.1813111.40440.082673
100.1415381.09630.138654
110.123310.95520.171667
120.0988190.76540.223503
130.0025450.01970.492168
14-0.080575-0.62410.267453
15-0.140328-1.0870.140698
16-0.191353-1.48220.071758
17-0.269151-2.08480.020674


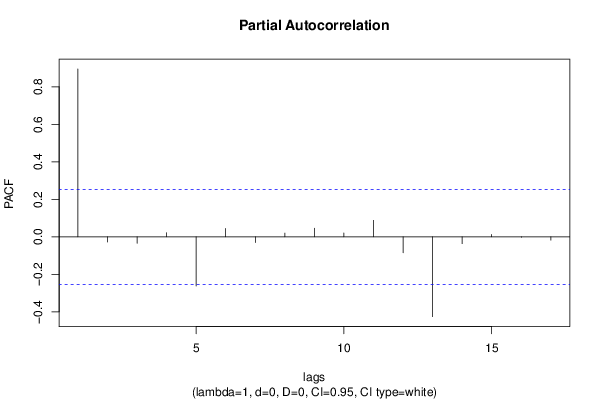
Partial Autocorrelation Function
Time lag kPACF(k)T-STATP-value
10.8957186.93820
2-0.027664-0.21430.415526
3-0.034687-0.26870.394546
40.0218870.16950.432972
5-0.262279-2.03160.023315
60.0445850.34540.365518
7-0.030186-0.23380.40796
80.0200230.15510.438633
90.0460540.35670.361273
100.0209180.1620.435914
110.0878690.68060.249363
12-0.085145-0.65950.256038
13-0.425885-3.29890.000818
14-0.036451-0.28240.389323
150.0125240.0970.461522
16-0.002259-0.01750.493048
17-0.017647-0.13670.445867

\begin{tabular}{lllllllll}
\hline
Partial Autocorrelation Function \tabularnewline
Time lag k & PACF(k) & T-STAT & P-value \tabularnewline
1 & 0.895718 & 6.9382 & 0 \tabularnewline
2 & -0.027664 & -0.2143 & 0.415526 \tabularnewline
3 & -0.034687 & -0.2687 & 0.394546 \tabularnewline
4 & 0.021887 & 0.1695 & 0.432972 \tabularnewline
5 & -0.262279 & -2.0316 & 0.023315 \tabularnewline
6 & 0.044585 & 0.3454 & 0.365518 \tabularnewline
7 & -0.030186 & -0.2338 & 0.40796 \tabularnewline
8 & 0.020023 & 0.1551 & 0.438633 \tabularnewline
9 & 0.046054 & 0.3567 & 0.361273 \tabularnewline
10 & 0.020918 & 0.162 & 0.435914 \tabularnewline
11 & 0.087869 & 0.6806 & 0.249363 \tabularnewline
12 & -0.085145 & -0.6595 & 0.256038 \tabularnewline
13 & -0.425885 & -3.2989 & 0.000818 \tabularnewline
14 & -0.036451 & -0.2824 & 0.389323 \tabularnewline
15 & 0.012524 & 0.097 & 0.461522 \tabularnewline
16 & -0.002259 & -0.0175 & 0.493048 \tabularnewline
17 & -0.017647 & -0.1367 & 0.445867 \tabularnewline
\hline
\end{tabular}
%Source: https://freestatistics.org/blog/index.php?pk=&T=2

[TABLE]
[ROW][C]Partial Autocorrelation Function[/C][/ROW]
[ROW][C]Time lag k[/C][C]PACF(k)[/C][C]T-STAT[/C][C]P-value[/C][/ROW]
[ROW][C]1[/C][C]0.895718[/C][C]6.9382[/C][C]0[/C][/ROW]
[ROW][C]2[/C][C]-0.027664[/C][C]-0.2143[/C][C]0.415526[/C][/ROW]
[ROW][C]3[/C][C]-0.034687[/C][C]-0.2687[/C][C]0.394546[/C][/ROW]
[ROW][C]4[/C][C]0.021887[/C][C]0.1695[/C][C]0.432972[/C][/ROW]
[ROW][C]5[/C][C]-0.262279[/C][C]-2.0316[/C][C]0.023315[/C][/ROW]
[ROW][C]6[/C][C]0.044585[/C][C]0.3454[/C][C]0.365518[/C][/ROW]
[ROW][C]7[/C][C]-0.030186[/C][C]-0.2338[/C][C]0.40796[/C][/ROW]
[ROW][C]8[/C][C]0.020023[/C][C]0.1551[/C][C]0.438633[/C][/ROW]
[ROW][C]9[/C][C]0.046054[/C][C]0.3567[/C][C]0.361273[/C][/ROW]
[ROW][C]10[/C][C]0.020918[/C][C]0.162[/C][C]0.435914[/C][/ROW]
[ROW][C]11[/C][C]0.087869[/C][C]0.6806[/C][C]0.249363[/C][/ROW]
[ROW][C]12[/C][C]-0.085145[/C][C]-0.6595[/C][C]0.256038[/C][/ROW]
[ROW][C]13[/C][C]-0.425885[/C][C]-3.2989[/C][C]0.000818[/C][/ROW]
[ROW][C]14[/C][C]-0.036451[/C][C]-0.2824[/C][C]0.389323[/C][/ROW]
[ROW][C]15[/C][C]0.012524[/C][C]0.097[/C][C]0.461522[/C][/ROW]
[ROW][C]16[/C][C]-0.002259[/C][C]-0.0175[/C][C]0.493048[/C][/ROW]
[ROW][C]17[/C][C]-0.017647[/C][C]-0.1367[/C][C]0.445867[/C][/ROW]
[/TABLE]
Source: https://freestatistics.org/blog/index.php?pk=&T=2

Globally Unique Identifier (entire table): ba.freestatistics.org/blog/index.php?pk=&T=2

As an alternative you can also use a QR Code:  

The GUIDs for individual cells are displayed in the table below:

Partial Autocorrelation Function
Time lag kPACF(k)T-STATP-value
10.8957186.93820
2-0.027664-0.21430.415526
3-0.034687-0.26870.394546
40.0218870.16950.432972
5-0.262279-2.03160.023315
60.0445850.34540.365518
7-0.030186-0.23380.40796
80.0200230.15510.438633
90.0460540.35670.361273
100.0209180.1620.435914
110.0878690.68060.249363
12-0.085145-0.65950.256038
13-0.425885-3.29890.000818
14-0.036451-0.28240.389323
150.0125240.0970.461522
16-0.002259-0.01750.493048
17-0.017647-0.13670.445867


Parameters (Session):
par1 = Default ; par2 = 1 ; par3 = 0 ; par4 = 0 ; par5 = 12 ; par6 = White Noise ; par7 = 0.95 ;
Parameters (R input):
par1 = Default ; par2 = 1 ; par3 = 0 ; par4 = 0 ; par5 = 12 ; par6 = White Noise ; par7 = 0.95 ; par8 = ;
R code (references can be found in the software module):
if (par1 == 'Default') {
par1 = 10*log10(length(x))
} else {
par1 <- as.numeric(par1)
}
par2 <- as.numeric(par2)
par3 <- as.numeric(par3)
par4 <- as.numeric(par4)
par5 <- as.numeric(par5)
if (par6 == 'White Noise') par6 <- 'white' else par6 <- 'ma'
par7 <- as.numeric(par7)
if (par8 != '') par8 <- as.numeric(par8)
x <- na.omit(x)
ox <- x
if (par8 == '') {
if (par2 == 0) {
x <- log(x)
} else {
x <- (x ^ par2 - 1) / par2
}
} else {
x <- log(x,base=par8)
}
if (par3 > 0) x <- diff(x,lag=1,difference=par3)
if (par4 > 0) x <- diff(x,lag=par5,difference=par4)
bitmap(file='picts.png')
op <- par(mfrow=c(2,1))
plot(ox,type='l',main='Original Time Series',xlab='time',ylab='value')
if (par8=='') {
mytitle <- paste('Working Time Series (lambda=',par2,', d=',par3,', D=',par4,')',sep='')
mysub <- paste('(lambda=',par2,', d=',par3,', D=',par4,', CI=', par7, ', CI type=',par6,')',sep='')
} else {
mytitle <- paste('Working Time Series (base=',par8,', d=',par3,', D=',par4,')',sep='')
mysub <- paste('(base=',par8,', d=',par3,', D=',par4,', CI=', par7, ', CI type=',par6,')',sep='')
}
plot(x,type='l', main=mytitle,xlab='time',ylab='value')
par(op)
dev.off()
bitmap(file='pic1.png')
racf <- acf(x, par1, main='Autocorrelation', xlab='time lag', ylab='ACF', ci.type=par6, ci=par7, sub=mysub)
dev.off()
bitmap(file='pic2.png')
rpacf <- pacf(x,par1,main='Partial Autocorrelation',xlab='lags',ylab='PACF',sub=mysub)
dev.off()
(myacf <- c(racf$acf))
(mypacf <- c(rpacf$acf))
lengthx <- length(x)
sqrtn <- sqrt(lengthx)
load(file='createtable')
a<-table.start()
a<-table.row.start(a)
a<-table.element(a,'Autocorrelation Function',4,TRUE)
a<-table.row.end(a)
a<-table.row.start(a)
a<-table.element(a,'Time lag k',header=TRUE)
a<-table.element(a,hyperlink('basics.htm','ACF(k)','click here for more information about the Autocorrelation Function'),header=TRUE)
a<-table.element(a,'T-STAT',header=TRUE)
a<-table.element(a,'P-value',header=TRUE)
a<-table.row.end(a)
for (i in 2:(par1+1)) {
a<-table.row.start(a)
a<-table.element(a,i-1,header=TRUE)
a<-table.element(a,round(myacf[i],6))
mytstat <- myacf[i]*sqrtn
a<-table.element(a,round(mytstat,4))
a<-table.element(a,round(1-pt(abs(mytstat),lengthx),6))
a<-table.row.end(a)
}
a<-table.end(a)
table.save(a,file='mytable.tab')
a<-table.start()
a<-table.row.start(a)
a<-table.element(a,'Partial Autocorrelation Function',4,TRUE)
a<-table.row.end(a)
a<-table.row.start(a)
a<-table.element(a,'Time lag k',header=TRUE)
a<-table.element(a,hyperlink('basics.htm','PACF(k)','click here for more information about the Partial Autocorrelation Function'),header=TRUE)
a<-table.element(a,'T-STAT',header=TRUE)
a<-table.element(a,'P-value',header=TRUE)
a<-table.row.end(a)
for (i in 1:par1) {
a<-table.row.start(a)
a<-table.element(a,i,header=TRUE)
a<-table.element(a,round(mypacf[i],6))
mytstat <- mypacf[i]*sqrtn
a<-table.element(a,round(mytstat,4))
a<-table.element(a,round(1-pt(abs(mytstat),lengthx),6))
a<-table.row.end(a)
}
a<-table.end(a)
table.save(a,file='mytable1.tab')