Free Statistics

of Irreproducible Research!

Author's title

Author*Unverified author*
R Software Modulerwasp_autocorrelation.wasp
Title produced by software(Partial) Autocorrelation Function
Date of computationThu, 18 May 2017 13:23:25 +0100
Cite this page as followsStatistical Computations at FreeStatistics.org, Office for Research Development and Education, URL https://freestatistics.org/blog/index.php?v=date/2017/May/18/t1495110250gp579zl2ra0drd3.htm/, Retrieved Fri, 17 May 2024 04:29:30 +0200
Statistical Computations at FreeStatistics.org, Office for Research Development and Education, URL https://freestatistics.org/blog/index.php?pk=, Retrieved Fri, 17 May 2024 04:29:30 +0200
QR Codes:

Original text written by user:
IsPrivate?No (this computation is public)
User-defined keywords
Estimated Impact0
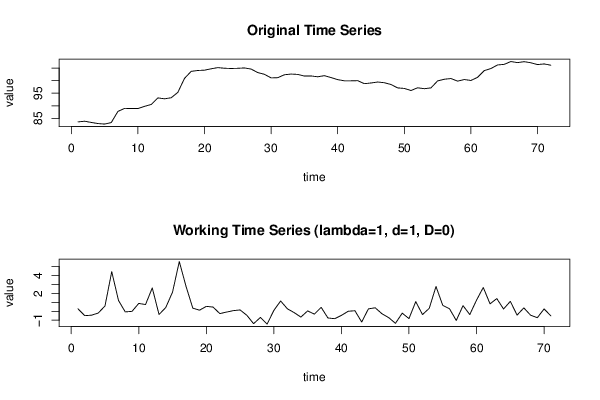
Dataseries X:
83,61
83,89
83,4
82,96
82,76
83,35
87,78
88,99
88,92
88,91
89,79
90,54
93,15
92,79
93,21
95,35
100,91
103,69
104,04
104,16
104,71
105,18
104,92
104,83
104,9
105,05
104,6
103,21
102,52
101,09
101,19
102,34
102,62
102,47
101,82
101,86
101,54
101,98
101,23
100,4
99,94
99,94
100
98,8
99,07
99,46
99,18
98,47
97,12
96,91
96,09
97,17
96,8
97,13
99,9
100,56
100,84
99,81
100,44
100,07
101,32
103,98
104,81
106,23
106,48
107,59
107,16
107,54
107,1
106,38
106,64
106,13


Summary of computational transaction
Raw Inputview raw input (R code)
Raw Outputview raw output of R engine
Computing time4 seconds
R Server'Gwilym Jenkins' @ jenkins.wessa.net

\begin{tabular}{lllllllll}
\hline
Summary of computational transaction \tabularnewline
Raw Input & view raw input (R code)  \tabularnewline
Raw Output & view raw output of R engine  \tabularnewline
Computing time & 4 seconds \tabularnewline
R Server & 'Gwilym Jenkins' @ jenkins.wessa.net \tabularnewline
\hline
\end{tabular}
%Source: https://freestatistics.org/blog/index.php?pk=&T=0

[TABLE]
[ROW][C]Summary of computational transaction[/C][/ROW]
[ROW][C]Raw Input[/C][C]view raw input (R code) [/C][/ROW]
[ROW][C]Raw Output[/C][C]view raw output of R engine [/C][/ROW]
[ROW][C]Computing time[/C][C]4 seconds[/C][/ROW]
[ROW][C]R Server[/C][C]'Gwilym Jenkins' @ jenkins.wessa.net[/C][/ROW]
[/TABLE]
Source: https://freestatistics.org/blog/index.php?pk=&T=0

Globally Unique Identifier (entire table): ba.freestatistics.org/blog/index.php?pk=&T=0

As an alternative you can also use a QR Code:  

The GUIDs for individual cells are displayed in the table below:

Summary of computational transaction
Raw Inputview raw input (R code)
Raw Outputview raw output of R engine
Computing time4 seconds
R Server'Gwilym Jenkins' @ jenkins.wessa.net


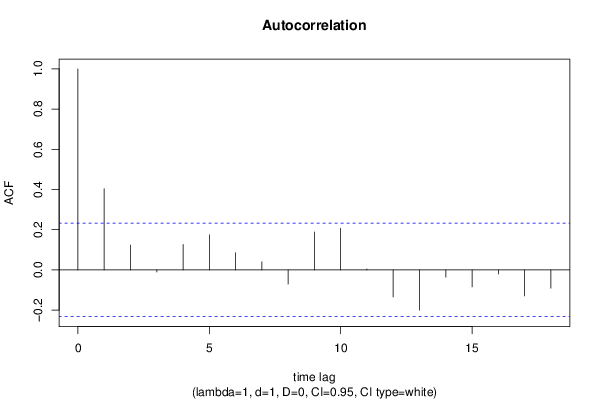
Autocorrelation Function
Time lag kACF(k)T-STATP-value
10.403773.40220.000551
20.1234781.04040.150832
3-0.010648-0.08970.464381
40.1262661.06390.145482
50.1744461.46990.073002
60.0857580.72260.236148
70.0401380.33820.368102
8-0.070645-0.59530.276779
90.1884281.58770.058397
100.2075191.74860.042342
110.0046210.03890.484523
12-0.13517-1.1390.129273
13-0.200291-1.68770.047931
14-0.035899-0.30250.381582
15-0.084353-0.71080.239777
16-0.020573-0.17340.431434
17-0.129282-1.08930.139842
18-0.090674-0.7640.223689

\begin{tabular}{lllllllll}
\hline
Autocorrelation Function \tabularnewline
Time lag k & ACF(k) & T-STAT & P-value \tabularnewline
1 & 0.40377 & 3.4022 & 0.000551 \tabularnewline
2 & 0.123478 & 1.0404 & 0.150832 \tabularnewline
3 & -0.010648 & -0.0897 & 0.464381 \tabularnewline
4 & 0.126266 & 1.0639 & 0.145482 \tabularnewline
5 & 0.174446 & 1.4699 & 0.073002 \tabularnewline
6 & 0.085758 & 0.7226 & 0.236148 \tabularnewline
7 & 0.040138 & 0.3382 & 0.368102 \tabularnewline
8 & -0.070645 & -0.5953 & 0.276779 \tabularnewline
9 & 0.188428 & 1.5877 & 0.058397 \tabularnewline
10 & 0.207519 & 1.7486 & 0.042342 \tabularnewline
11 & 0.004621 & 0.0389 & 0.484523 \tabularnewline
12 & -0.13517 & -1.139 & 0.129273 \tabularnewline
13 & -0.200291 & -1.6877 & 0.047931 \tabularnewline
14 & -0.035899 & -0.3025 & 0.381582 \tabularnewline
15 & -0.084353 & -0.7108 & 0.239777 \tabularnewline
16 & -0.020573 & -0.1734 & 0.431434 \tabularnewline
17 & -0.129282 & -1.0893 & 0.139842 \tabularnewline
18 & -0.090674 & -0.764 & 0.223689 \tabularnewline
\hline
\end{tabular}
%Source: https://freestatistics.org/blog/index.php?pk=&T=1

[TABLE]
[ROW][C]Autocorrelation Function[/C][/ROW]
[ROW][C]Time lag k[/C][C]ACF(k)[/C][C]T-STAT[/C][C]P-value[/C][/ROW]
[ROW][C]1[/C][C]0.40377[/C][C]3.4022[/C][C]0.000551[/C][/ROW]
[ROW][C]2[/C][C]0.123478[/C][C]1.0404[/C][C]0.150832[/C][/ROW]
[ROW][C]3[/C][C]-0.010648[/C][C]-0.0897[/C][C]0.464381[/C][/ROW]
[ROW][C]4[/C][C]0.126266[/C][C]1.0639[/C][C]0.145482[/C][/ROW]
[ROW][C]5[/C][C]0.174446[/C][C]1.4699[/C][C]0.073002[/C][/ROW]
[ROW][C]6[/C][C]0.085758[/C][C]0.7226[/C][C]0.236148[/C][/ROW]
[ROW][C]7[/C][C]0.040138[/C][C]0.3382[/C][C]0.368102[/C][/ROW]
[ROW][C]8[/C][C]-0.070645[/C][C]-0.5953[/C][C]0.276779[/C][/ROW]
[ROW][C]9[/C][C]0.188428[/C][C]1.5877[/C][C]0.058397[/C][/ROW]
[ROW][C]10[/C][C]0.207519[/C][C]1.7486[/C][C]0.042342[/C][/ROW]
[ROW][C]11[/C][C]0.004621[/C][C]0.0389[/C][C]0.484523[/C][/ROW]
[ROW][C]12[/C][C]-0.13517[/C][C]-1.139[/C][C]0.129273[/C][/ROW]
[ROW][C]13[/C][C]-0.200291[/C][C]-1.6877[/C][C]0.047931[/C][/ROW]
[ROW][C]14[/C][C]-0.035899[/C][C]-0.3025[/C][C]0.381582[/C][/ROW]
[ROW][C]15[/C][C]-0.084353[/C][C]-0.7108[/C][C]0.239777[/C][/ROW]
[ROW][C]16[/C][C]-0.020573[/C][C]-0.1734[/C][C]0.431434[/C][/ROW]
[ROW][C]17[/C][C]-0.129282[/C][C]-1.0893[/C][C]0.139842[/C][/ROW]
[ROW][C]18[/C][C]-0.090674[/C][C]-0.764[/C][C]0.223689[/C][/ROW]
[/TABLE]
Source: https://freestatistics.org/blog/index.php?pk=&T=1

Globally Unique Identifier (entire table): ba.freestatistics.org/blog/index.php?pk=&T=1

As an alternative you can also use a QR Code:  

The GUIDs for individual cells are displayed in the table below:

Autocorrelation Function
Time lag kACF(k)T-STATP-value
10.403773.40220.000551
20.1234781.04040.150832
3-0.010648-0.08970.464381
40.1262661.06390.145482
50.1744461.46990.073002
60.0857580.72260.236148
70.0401380.33820.368102
8-0.070645-0.59530.276779
90.1884281.58770.058397
100.2075191.74860.042342
110.0046210.03890.484523
12-0.13517-1.1390.129273
13-0.200291-1.68770.047931
14-0.035899-0.30250.381582
15-0.084353-0.71080.239777
16-0.020573-0.17340.431434
17-0.129282-1.08930.139842
18-0.090674-0.7640.223689


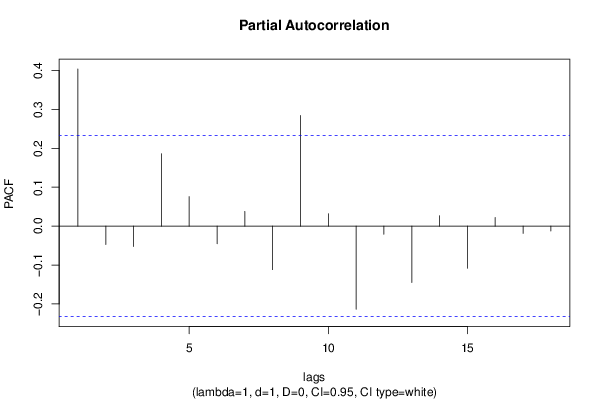
Partial Autocorrelation Function
Time lag kPACF(k)T-STATP-value
10.403773.40220.000551
2-0.047257-0.39820.345841
3-0.052424-0.44170.330011
40.1861271.56830.060625
50.0757510.63830.26267
6-0.045549-0.38380.351135
70.0378010.31850.375513
8-0.111763-0.94170.174762
90.2841732.39450.009643
100.0319190.2690.394374
11-0.213764-1.80120.037958
12-0.021075-0.17760.42978
13-0.145099-1.22260.112757
140.0267330.22530.411214
15-0.108469-0.9140.181912
160.022150.18660.426236
17-0.018719-0.15770.437559
18-0.012742-0.10740.457402

\begin{tabular}{lllllllll}
\hline
Partial Autocorrelation Function \tabularnewline
Time lag k & PACF(k) & T-STAT & P-value \tabularnewline
1 & 0.40377 & 3.4022 & 0.000551 \tabularnewline
2 & -0.047257 & -0.3982 & 0.345841 \tabularnewline
3 & -0.052424 & -0.4417 & 0.330011 \tabularnewline
4 & 0.186127 & 1.5683 & 0.060625 \tabularnewline
5 & 0.075751 & 0.6383 & 0.26267 \tabularnewline
6 & -0.045549 & -0.3838 & 0.351135 \tabularnewline
7 & 0.037801 & 0.3185 & 0.375513 \tabularnewline
8 & -0.111763 & -0.9417 & 0.174762 \tabularnewline
9 & 0.284173 & 2.3945 & 0.009643 \tabularnewline
10 & 0.031919 & 0.269 & 0.394374 \tabularnewline
11 & -0.213764 & -1.8012 & 0.037958 \tabularnewline
12 & -0.021075 & -0.1776 & 0.42978 \tabularnewline
13 & -0.145099 & -1.2226 & 0.112757 \tabularnewline
14 & 0.026733 & 0.2253 & 0.411214 \tabularnewline
15 & -0.108469 & -0.914 & 0.181912 \tabularnewline
16 & 0.02215 & 0.1866 & 0.426236 \tabularnewline
17 & -0.018719 & -0.1577 & 0.437559 \tabularnewline
18 & -0.012742 & -0.1074 & 0.457402 \tabularnewline
\hline
\end{tabular}
%Source: https://freestatistics.org/blog/index.php?pk=&T=2

[TABLE]
[ROW][C]Partial Autocorrelation Function[/C][/ROW]
[ROW][C]Time lag k[/C][C]PACF(k)[/C][C]T-STAT[/C][C]P-value[/C][/ROW]
[ROW][C]1[/C][C]0.40377[/C][C]3.4022[/C][C]0.000551[/C][/ROW]
[ROW][C]2[/C][C]-0.047257[/C][C]-0.3982[/C][C]0.345841[/C][/ROW]
[ROW][C]3[/C][C]-0.052424[/C][C]-0.4417[/C][C]0.330011[/C][/ROW]
[ROW][C]4[/C][C]0.186127[/C][C]1.5683[/C][C]0.060625[/C][/ROW]
[ROW][C]5[/C][C]0.075751[/C][C]0.6383[/C][C]0.26267[/C][/ROW]
[ROW][C]6[/C][C]-0.045549[/C][C]-0.3838[/C][C]0.351135[/C][/ROW]
[ROW][C]7[/C][C]0.037801[/C][C]0.3185[/C][C]0.375513[/C][/ROW]
[ROW][C]8[/C][C]-0.111763[/C][C]-0.9417[/C][C]0.174762[/C][/ROW]
[ROW][C]9[/C][C]0.284173[/C][C]2.3945[/C][C]0.009643[/C][/ROW]
[ROW][C]10[/C][C]0.031919[/C][C]0.269[/C][C]0.394374[/C][/ROW]
[ROW][C]11[/C][C]-0.213764[/C][C]-1.8012[/C][C]0.037958[/C][/ROW]
[ROW][C]12[/C][C]-0.021075[/C][C]-0.1776[/C][C]0.42978[/C][/ROW]
[ROW][C]13[/C][C]-0.145099[/C][C]-1.2226[/C][C]0.112757[/C][/ROW]
[ROW][C]14[/C][C]0.026733[/C][C]0.2253[/C][C]0.411214[/C][/ROW]
[ROW][C]15[/C][C]-0.108469[/C][C]-0.914[/C][C]0.181912[/C][/ROW]
[ROW][C]16[/C][C]0.02215[/C][C]0.1866[/C][C]0.426236[/C][/ROW]
[ROW][C]17[/C][C]-0.018719[/C][C]-0.1577[/C][C]0.437559[/C][/ROW]
[ROW][C]18[/C][C]-0.012742[/C][C]-0.1074[/C][C]0.457402[/C][/ROW]
[/TABLE]
Source: https://freestatistics.org/blog/index.php?pk=&T=2

Globally Unique Identifier (entire table): ba.freestatistics.org/blog/index.php?pk=&T=2

As an alternative you can also use a QR Code:  

The GUIDs for individual cells are displayed in the table below:

Partial Autocorrelation Function
Time lag kPACF(k)T-STATP-value
10.403773.40220.000551
2-0.047257-0.39820.345841
3-0.052424-0.44170.330011
40.1861271.56830.060625
50.0757510.63830.26267
6-0.045549-0.38380.351135
70.0378010.31850.375513
8-0.111763-0.94170.174762
90.2841732.39450.009643
100.0319190.2690.394374
11-0.213764-1.80120.037958
12-0.021075-0.17760.42978
13-0.145099-1.22260.112757
140.0267330.22530.411214
15-0.108469-0.9140.181912
160.022150.18660.426236
17-0.018719-0.15770.437559
18-0.012742-0.10740.457402


Parameters (Session):
par1 = 24 ; par2 = grey ; par3 = FALSE ; par4 = Unknown ;
Parameters (R input):
par1 = Default ; par2 = 1 ; par3 = 1 ; par4 = 0 ; par5 = 12 ; par6 = White Noise ; par7 = 0.95 ; par8 = ;
R code (references can be found in the software module):
if (par1 == 'Default') {
par1 = 10*log10(length(x))
} else {
par1 <- as.numeric(par1)
}
par2 <- as.numeric(par2)
par3 <- as.numeric(par3)
par4 <- as.numeric(par4)
par5 <- as.numeric(par5)
if (par6 == 'White Noise') par6 <- 'white' else par6 <- 'ma'
par7 <- as.numeric(par7)
if (par8 != '') par8 <- as.numeric(par8)
x <- na.omit(x)
ox <- x
if (par8 == '') {
if (par2 == 0) {
x <- log(x)
} else {
x <- (x ^ par2 - 1) / par2
}
} else {
x <- log(x,base=par8)
}
if (par3 > 0) x <- diff(x,lag=1,difference=par3)
if (par4 > 0) x <- diff(x,lag=par5,difference=par4)
bitmap(file='picts.png')
op <- par(mfrow=c(2,1))
plot(ox,type='l',main='Original Time Series',xlab='time',ylab='value')
if (par8=='') {
mytitle <- paste('Working Time Series (lambda=',par2,', d=',par3,', D=',par4,')',sep='')
mysub <- paste('(lambda=',par2,', d=',par3,', D=',par4,', CI=', par7, ', CI type=',par6,')',sep='')
} else {
mytitle <- paste('Working Time Series (base=',par8,', d=',par3,', D=',par4,')',sep='')
mysub <- paste('(base=',par8,', d=',par3,', D=',par4,', CI=', par7, ', CI type=',par6,')',sep='')
}
plot(x,type='l', main=mytitle,xlab='time',ylab='value')
par(op)
dev.off()
bitmap(file='pic1.png')
racf <- acf(x, par1, main='Autocorrelation', xlab='time lag', ylab='ACF', ci.type=par6, ci=par7, sub=mysub)
dev.off()
bitmap(file='pic2.png')
rpacf <- pacf(x,par1,main='Partial Autocorrelation',xlab='lags',ylab='PACF',sub=mysub)
dev.off()
(myacf <- c(racf$acf))
(mypacf <- c(rpacf$acf))
lengthx <- length(x)
sqrtn <- sqrt(lengthx)
load(file='createtable')
a<-table.start()
a<-table.row.start(a)
a<-table.element(a,'Autocorrelation Function',4,TRUE)
a<-table.row.end(a)
a<-table.row.start(a)
a<-table.element(a,'Time lag k',header=TRUE)
a<-table.element(a,hyperlink('basics.htm','ACF(k)','click here for more information about the Autocorrelation Function'),header=TRUE)
a<-table.element(a,'T-STAT',header=TRUE)
a<-table.element(a,'P-value',header=TRUE)
a<-table.row.end(a)
for (i in 2:(par1+1)) {
a<-table.row.start(a)
a<-table.element(a,i-1,header=TRUE)
a<-table.element(a,round(myacf[i],6))
mytstat <- myacf[i]*sqrtn
a<-table.element(a,round(mytstat,4))
a<-table.element(a,round(1-pt(abs(mytstat),lengthx),6))
a<-table.row.end(a)
}
a<-table.end(a)
table.save(a,file='mytable.tab')
a<-table.start()
a<-table.row.start(a)
a<-table.element(a,'Partial Autocorrelation Function',4,TRUE)
a<-table.row.end(a)
a<-table.row.start(a)
a<-table.element(a,'Time lag k',header=TRUE)
a<-table.element(a,hyperlink('basics.htm','PACF(k)','click here for more information about the Partial Autocorrelation Function'),header=TRUE)
a<-table.element(a,'T-STAT',header=TRUE)
a<-table.element(a,'P-value',header=TRUE)
a<-table.row.end(a)
for (i in 1:par1) {
a<-table.row.start(a)
a<-table.element(a,i,header=TRUE)
a<-table.element(a,round(mypacf[i],6))
mytstat <- mypacf[i]*sqrtn
a<-table.element(a,round(mytstat,4))
a<-table.element(a,round(1-pt(abs(mytstat),lengthx),6))
a<-table.row.end(a)
}
a<-table.end(a)
table.save(a,file='mytable1.tab')