Free Statistics

of Irreproducible Research!

Author's title

Author*Unverified author*
R Software Modulerwasp_smp.wasp
Title produced by softwareStandard Deviation-Mean Plot
Date of computationThu, 18 May 2017 13:09:04 +0100
Cite this page as followsStatistical Computations at FreeStatistics.org, Office for Research Development and Education, URL https://freestatistics.org/blog/index.php?v=date/2017/May/18/t1495109698s2qbl5lzykqeitk.htm/, Retrieved Fri, 17 May 2024 08:27:45 +0200
Statistical Computations at FreeStatistics.org, Office for Research Development and Education, URL https://freestatistics.org/blog/index.php?pk=, Retrieved Fri, 17 May 2024 08:27:45 +0200
QR Codes:

Original text written by user:
IsPrivate?No (this computation is public)
User-defined keywords
Estimated Impact0
Dataseries X:
20709.9
21227.3
23009.8
20416.2
20929.6
20763.9
19607.4
19419
19584.9
21878
21745.5
19206.8
21041.3
20407.1
22437
21050.3
20415.7
20220.6
20217.8
18286.4
20781.3
21619.6
20417.6
19988.6
21026.9
20128.3
21671.5
21053.2
19978.6
20572.6
20220.4
19107.6
21989.5
21701.2
19758.3
19843.9
18906.2
19071.2
22385.6
20208.5
19261.4
21470.1
19539.9
17665.1
19917.2
20399.5
19263
19026
18375.4
20165
21138.7
21414.3
20799.2
22773.6
19747.2
19910.7
22051.7
21705
22328.8
20910.3


Summary of computational transaction
Raw Inputview raw input (R code)
Raw Outputview raw output of R engine
Computing time3 seconds
R Server'Sir Ronald Aylmer Fisher' @ fisher.wessa.net
R Framework error message
Warning: there are blank lines in the 'Data' field.
Please, use NA for missing data - blank lines are simply
 deleted and are NOT treated as missing values.

\begin{tabular}{lllllllll}
\hline
Summary of computational transaction \tabularnewline
Raw Input & view raw input (R code)  \tabularnewline
Raw Output & view raw output of R engine  \tabularnewline
Computing time & 3 seconds \tabularnewline
R Server & 'Sir Ronald Aylmer Fisher' @ fisher.wessa.net \tabularnewline
R Framework error message & 
Warning: there are blank lines in the 'Data' field.
Please, use NA for missing data - blank lines are simply
 deleted and are NOT treated as missing values.
\tabularnewline \hline \end{tabular} %Source: https://freestatistics.org/blog/index.php?pk=&T=0

[TABLE]
[ROW][C]Summary of computational transaction[/C][/ROW]
[ROW][C]Raw Input[/C][C]view raw input (R code) [/C][/ROW]
[ROW][C]Raw Output[/C][C]view raw output of R engine [/C][/ROW]
[ROW][C]Computing time[/C][C]3 seconds[/C][/ROW]
[ROW][C]R Server[/C][C]'Sir Ronald Aylmer Fisher' @ fisher.wessa.net[/C][/ROW]
[ROW][C]R Framework error message[/C][C]
Warning: there are blank lines in the 'Data' field.
Please, use NA for missing data - blank lines are simply
 deleted and are NOT treated as missing values.
[/C][/ROW] [/TABLE] Source: https://freestatistics.org/blog/index.php?pk=&T=0

Globally Unique Identifier (entire table): ba.freestatistics.org/blog/index.php?pk=&T=0

As an alternative you can also use a QR Code:  

The GUIDs for individual cells are displayed in the table below:

Summary of computational transaction
Raw Inputview raw input (R code)
Raw Outputview raw output of R engine
Computing time3 seconds
R Server'Sir Ronald Aylmer Fisher' @ fisher.wessa.net
R Framework error message
Warning: there are blank lines in the 'Data' field.
Please, use NA for missing data - blank lines are simply
 deleted and are NOT treated as missing values.


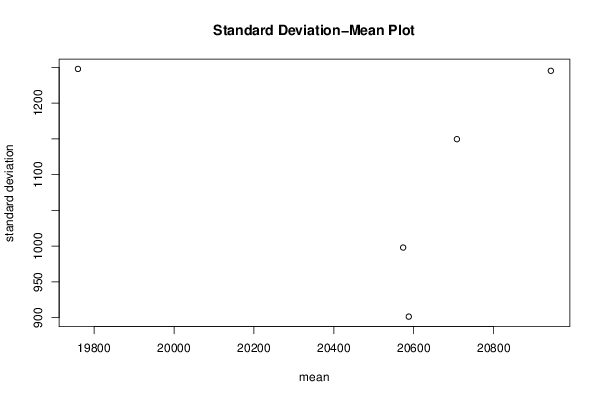
Standard Deviation-Mean Plot
SectionMeanStandard DeviationRange
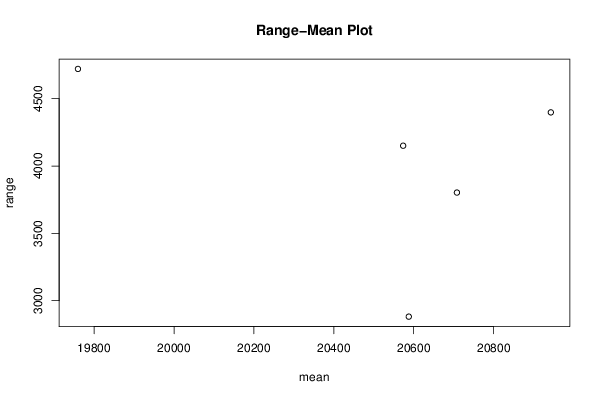
120708.19166666671149.641848148873803
220573.6083333333998.0527937013914150.6
320587.6666666667901.4212054844122881.9
419759.4751247.829944070184720.5
520943.3251245.2455406834398.2

\begin{tabular}{lllllllll}
\hline
Standard Deviation-Mean Plot \tabularnewline
Section & Mean & Standard Deviation & Range \tabularnewline
1 & 20708.1916666667 & 1149.64184814887 & 3803 \tabularnewline
2 & 20573.6083333333 & 998.052793701391 & 4150.6 \tabularnewline
3 & 20587.6666666667 & 901.421205484412 & 2881.9 \tabularnewline
4 & 19759.475 & 1247.82994407018 & 4720.5 \tabularnewline
5 & 20943.325 & 1245.245540683 & 4398.2 \tabularnewline
\hline
\end{tabular}
%Source: https://freestatistics.org/blog/index.php?pk=&T=1

[TABLE]
[ROW][C]Standard Deviation-Mean Plot[/C][/ROW]
[ROW][C]Section[/C][C]Mean[/C][C]Standard Deviation[/C][C]Range[/C][/ROW]
[ROW][C]1[/C][C]20708.1916666667[/C][C]1149.64184814887[/C][C]3803[/C][/ROW]
[ROW][C]2[/C][C]20573.6083333333[/C][C]998.052793701391[/C][C]4150.6[/C][/ROW]
[ROW][C]3[/C][C]20587.6666666667[/C][C]901.421205484412[/C][C]2881.9[/C][/ROW]
[ROW][C]4[/C][C]19759.475[/C][C]1247.82994407018[/C][C]4720.5[/C][/ROW]
[ROW][C]5[/C][C]20943.325[/C][C]1245.245540683[/C][C]4398.2[/C][/ROW]
[/TABLE]
Source: https://freestatistics.org/blog/index.php?pk=&T=1

Globally Unique Identifier (entire table): ba.freestatistics.org/blog/index.php?pk=&T=1

As an alternative you can also use a QR Code:  

The GUIDs for individual cells are displayed in the table below:

Standard Deviation-Mean Plot
SectionMeanStandard DeviationRange
120708.19166666671149.641848148873803
220573.6083333333998.0527937013914150.6
320587.6666666667901.4212054844122881.9
419759.4751247.829944070184720.5
520943.3251245.2455406834398.2


Regression: S.E.(k) = alpha + beta * Mean(k)
alpha2653.29433895988
beta-0.0753057391995971
S.D.0.193983081651811
T-STAT-0.38820776821541
p-value0.723771245958843

\begin{tabular}{lllllllll}
\hline
Regression: S.E.(k) = alpha + beta * Mean(k) \tabularnewline
alpha & 2653.29433895988 \tabularnewline
beta & -0.0753057391995971 \tabularnewline
S.D. & 0.193983081651811 \tabularnewline
T-STAT & -0.38820776821541 \tabularnewline
p-value & 0.723771245958843 \tabularnewline
\hline
\end{tabular}
%Source: https://freestatistics.org/blog/index.php?pk=&T=2

[TABLE]
[ROW][C]Regression: S.E.(k) = alpha + beta * Mean(k)[/C][/ROW]
[ROW][C]alpha[/C][C]2653.29433895988[/C][/ROW]
[ROW][C]beta[/C][C]-0.0753057391995971[/C][/ROW]
[ROW][C]S.D.[/C][C]0.193983081651811[/C][/ROW]
[ROW][C]T-STAT[/C][C]-0.38820776821541[/C][/ROW]
[ROW][C]p-value[/C][C]0.723771245958843[/C][/ROW]
[/TABLE]
Source: https://freestatistics.org/blog/index.php?pk=&T=2

Globally Unique Identifier (entire table): ba.freestatistics.org/blog/index.php?pk=&T=2

As an alternative you can also use a QR Code:  

The GUIDs for individual cells are displayed in the table below:

Regression: S.E.(k) = alpha + beta * Mean(k)
alpha2653.29433895988
beta-0.0753057391995971
S.D.0.193983081651811
T-STAT-0.38820776821541
p-value0.723771245958843


Regression: ln S.E.(k) = alpha + beta * ln Mean(k)
alpha20.9865746696808
beta-1.40843606196445
S.D.3.6688838799724
T-STAT-0.383886791744156
p-value0.726654077788701
Lambda2.40843606196445

\begin{tabular}{lllllllll}
\hline
Regression: ln S.E.(k) = alpha + beta * ln Mean(k) \tabularnewline
alpha & 20.9865746696808 \tabularnewline
beta & -1.40843606196445 \tabularnewline
S.D. & 3.6688838799724 \tabularnewline
T-STAT & -0.383886791744156 \tabularnewline
p-value & 0.726654077788701 \tabularnewline
Lambda & 2.40843606196445 \tabularnewline
\hline
\end{tabular}
%Source: https://freestatistics.org/blog/index.php?pk=&T=3

[TABLE]
[ROW][C]Regression: ln S.E.(k) = alpha + beta * ln Mean(k)[/C][/ROW]
[ROW][C]alpha[/C][C]20.9865746696808[/C][/ROW]
[ROW][C]beta[/C][C]-1.40843606196445[/C][/ROW]
[ROW][C]S.D.[/C][C]3.6688838799724[/C][/ROW]
[ROW][C]T-STAT[/C][C]-0.383886791744156[/C][/ROW]
[ROW][C]p-value[/C][C]0.726654077788701[/C][/ROW]
[ROW][C]Lambda[/C][C]2.40843606196445[/C][/ROW]
[/TABLE]
Source: https://freestatistics.org/blog/index.php?pk=&T=3

Globally Unique Identifier (entire table): ba.freestatistics.org/blog/index.php?pk=&T=3

As an alternative you can also use a QR Code:  

The GUIDs for individual cells are displayed in the table below:

Regression: ln S.E.(k) = alpha + beta * ln Mean(k)
alpha20.9865746696808
beta-1.40843606196445
S.D.3.6688838799724
T-STAT-0.383886791744156
p-value0.726654077788701
Lambda2.40843606196445


Parameters (Session):
par1 = 12 ;
Parameters (R input):
par1 = 12 ;
R code (references can be found in the software module):
par1 <- as.numeric(par1)
(n <- length(x))
(np <- floor(n / par1))
arr <- array(NA,dim=c(par1,np))
j <- 0
k <- 1
for (i in 1:(np*par1))
{
j = j + 1
arr[j,k] <- x[i]
if (j == par1) {
j = 0
k=k+1
}
}
arr
arr.mean <- array(NA,dim=np)
arr.sd <- array(NA,dim=np)
arr.range <- array(NA,dim=np)
for (j in 1:np)
{
arr.mean[j] <- mean(arr[,j],na.rm=TRUE)
arr.sd[j] <- sd(arr[,j],na.rm=TRUE)
arr.range[j] <- max(arr[,j],na.rm=TRUE) - min(arr[,j],na.rm=TRUE)
}
arr.mean
arr.sd
arr.range
(lm1 <- lm(arr.sd~arr.mean))
(lnlm1 <- lm(log(arr.sd)~log(arr.mean)))
(lm2 <- lm(arr.range~arr.mean))
bitmap(file='test1.png')
plot(arr.mean,arr.sd,main='Standard Deviation-Mean Plot',xlab='mean',ylab='standard deviation')
dev.off()
bitmap(file='test2.png')
plot(arr.mean,arr.range,main='Range-Mean Plot',xlab='mean',ylab='range')
dev.off()
load(file='createtable')
a<-table.start()
a<-table.row.start(a)
a<-table.element(a,'Standard Deviation-Mean Plot',4,TRUE)
a<-table.row.end(a)
a<-table.row.start(a)
a<-table.element(a,'Section',header=TRUE)
a<-table.element(a,'Mean',header=TRUE)
a<-table.element(a,'Standard Deviation',header=TRUE)
a<-table.element(a,'Range',header=TRUE)
a<-table.row.end(a)
for (j in 1:np) {
a<-table.row.start(a)
a<-table.element(a,j,header=TRUE)
a<-table.element(a,arr.mean[j])
a<-table.element(a,arr.sd[j] )
a<-table.element(a,arr.range[j] )
a<-table.row.end(a)
}
a<-table.end(a)
table.save(a,file='mytable.tab')
a<-table.start()
a<-table.row.start(a)
a<-table.element(a,'Regression: S.E.(k) = alpha + beta * Mean(k)',2,TRUE)
a<-table.row.end(a)
a<-table.row.start(a)
a<-table.element(a,'alpha',header=TRUE)
a<-table.element(a,lm1$coefficients[[1]])
a<-table.row.end(a)
a<-table.row.start(a)
a<-table.element(a,'beta',header=TRUE)
a<-table.element(a,lm1$coefficients[[2]])
a<-table.row.end(a)
a<-table.row.start(a)
a<-table.element(a,'S.D.',header=TRUE)
a<-table.element(a,summary(lm1)$coefficients[2,2])
a<-table.row.end(a)
a<-table.row.start(a)
a<-table.element(a,'T-STAT',header=TRUE)
a<-table.element(a,summary(lm1)$coefficients[2,3])
a<-table.row.end(a)
a<-table.row.start(a)
a<-table.element(a,'p-value',header=TRUE)
a<-table.element(a,summary(lm1)$coefficients[2,4])
a<-table.row.end(a)
a<-table.end(a)
table.save(a,file='mytable1.tab')
a<-table.start()
a<-table.row.start(a)
a<-table.element(a,'Regression: ln S.E.(k) = alpha + beta * ln Mean(k)',2,TRUE)
a<-table.row.end(a)
a<-table.row.start(a)
a<-table.element(a,'alpha',header=TRUE)
a<-table.element(a,lnlm1$coefficients[[1]])
a<-table.row.end(a)
a<-table.row.start(a)
a<-table.element(a,'beta',header=TRUE)
a<-table.element(a,lnlm1$coefficients[[2]])
a<-table.row.end(a)
a<-table.row.start(a)
a<-table.element(a,'S.D.',header=TRUE)
a<-table.element(a,summary(lnlm1)$coefficients[2,2])
a<-table.row.end(a)
a<-table.row.start(a)
a<-table.element(a,'T-STAT',header=TRUE)
a<-table.element(a,summary(lnlm1)$coefficients[2,3])
a<-table.row.end(a)
a<-table.row.start(a)
a<-table.element(a,'p-value',header=TRUE)
a<-table.element(a,summary(lnlm1)$coefficients[2,4])
a<-table.row.end(a)
a<-table.row.start(a)
a<-table.element(a,'Lambda',header=TRUE)
a<-table.element(a,1-lnlm1$coefficients[[2]])
a<-table.row.end(a)
a<-table.end(a)
table.save(a,file='mytable2.tab')