Free Statistics

of Irreproducible Research!

Author's title

Author*Unverified author*
R Software Modulerwasp_autocorrelation.wasp
Title produced by software(Partial) Autocorrelation Function
Date of computationWed, 17 May 2017 19:58:35 +0100
Cite this page as followsStatistical Computations at FreeStatistics.org, Office for Research Development and Education, URL https://freestatistics.org/blog/index.php?v=date/2017/May/17/t1495047562yiobltrlt0ek84v.htm/, Retrieved Fri, 17 May 2024 06:50:13 +0200
Statistical Computations at FreeStatistics.org, Office for Research Development and Education, URL https://freestatistics.org/blog/index.php?pk=, Retrieved Fri, 17 May 2024 06:50:13 +0200
QR Codes:

Original text written by user:
IsPrivate?No (this computation is public)
User-defined keywords
Estimated Impact0
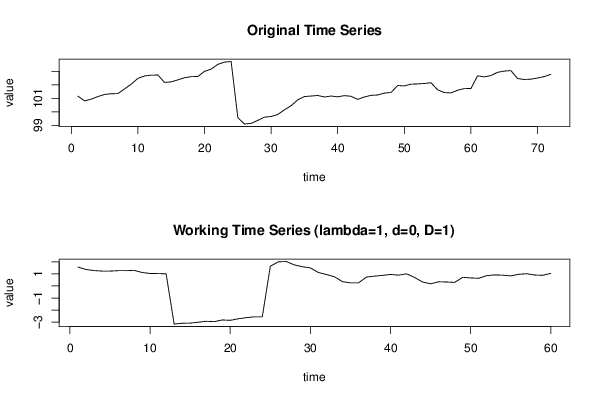
Dataseries X:
101.16
100.81
100.94
101.13
101.29
101.34
101.35
101.7
102.05
102.48
102.66
102.72
102.73
102.18
102.22
102.37
102.53
102.61
102.62
103
103.17
103.52
103.69
103.73
99.57
99.09
99.14
99.36
99.6
99.65
99.8
100.15
100.45
100.89
101.13
101.17
101.21
101.1
101.17
101.11
101.2
101.15
100.92
101.1
101.22
101.25
101.39
101.43
101.95
101.92
102.05
102.07
102.1
102.16
101.63
101.43
101.4
101.6
101.72
101.73
102.67
102.59
102.69
102.93
103.02
103.06
102.47
102.4
102.42
102.51
102.61
102.78


Summary of computational transaction
Raw Inputview raw input (R code)
Raw Outputview raw output of R engine
Computing time3 seconds
R Server'Sir Maurice George Kendall' @ kendall.wessa.net

\begin{tabular}{lllllllll}
\hline
Summary of computational transaction \tabularnewline
Raw Input & view raw input (R code)  \tabularnewline
Raw Output & view raw output of R engine  \tabularnewline
Computing time & 3 seconds \tabularnewline
R Server & 'Sir Maurice George Kendall' @ kendall.wessa.net \tabularnewline
\hline
\end{tabular}
%Source: https://freestatistics.org/blog/index.php?pk=&T=0

[TABLE]
[ROW][C]Summary of computational transaction[/C][/ROW]
[ROW][C]Raw Input[/C][C]view raw input (R code) [/C][/ROW]
[ROW][C]Raw Output[/C][C]view raw output of R engine [/C][/ROW]
[ROW][C]Computing time[/C][C]3 seconds[/C][/ROW]
[ROW][C]R Server[/C][C]'Sir Maurice George Kendall' @ kendall.wessa.net[/C][/ROW]
[/TABLE]
Source: https://freestatistics.org/blog/index.php?pk=&T=0

Globally Unique Identifier (entire table): ba.freestatistics.org/blog/index.php?pk=&T=0

As an alternative you can also use a QR Code:  

The GUIDs for individual cells are displayed in the table below:

Summary of computational transaction
Raw Inputview raw input (R code)
Raw Outputview raw output of R engine
Computing time3 seconds
R Server'Sir Maurice George Kendall' @ kendall.wessa.net


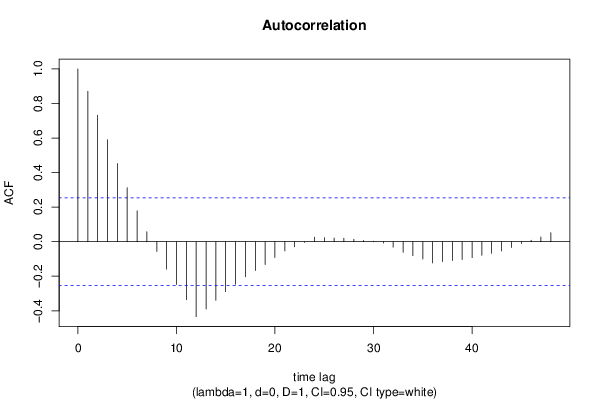
Autocorrelation Function
Time lag kACF(k)T-STATP-value
10.8704076.74210
20.7315615.66670
30.5904724.57381.2e-05
40.4524613.50470.000435
50.3125342.42090.009263
60.1786181.38360.085808
70.0581620.45050.32698
8-0.055962-0.43350.33311
9-0.158912-1.23090.111577
10-0.247991-1.92090.029748
11-0.336245-2.60450.00579
12-0.433926-3.36120.000677
13-0.39015-3.02210.001844
14-0.338828-2.62450.005494
15-0.289064-2.23910.014435
16-0.246455-1.9090.030522
17-0.203396-1.57550.0602
18-0.166432-1.28920.101143
19-0.132008-1.02250.155318
20-0.091311-0.70730.241062
21-0.05312-0.41150.341099
22-0.028892-0.22380.411839
23-0.00409-0.03170.487417
240.0261740.20270.420011
250.0234760.18180.42816
260.0209730.16250.435747
270.019640.15210.439796
280.0143770.11140.45585
290.0068070.05270.479063
300.0028860.02240.49112
31-0.007524-0.05830.47686
32-0.031618-0.24490.40368
33-0.060832-0.47120.319602
34-0.08059-0.62420.267417
35-0.100039-0.77490.220721
36-0.122818-0.95130.172623
37-0.114869-0.88980.188572
38-0.108679-0.84180.201614
39-0.10353-0.80190.212877
40-0.092515-0.71660.238195
41-0.07829-0.60640.273257
42-0.066665-0.51640.303742
43-0.053635-0.41550.339645
44-0.033758-0.26150.397305
45-0.010486-0.08120.467767
460.0086340.06690.473451
470.0275080.21310.415996
480.0521380.40390.343876

\begin{tabular}{lllllllll}
\hline
Autocorrelation Function \tabularnewline
Time lag k & ACF(k) & T-STAT & P-value \tabularnewline
1 & 0.870407 & 6.7421 & 0 \tabularnewline
2 & 0.731561 & 5.6667 & 0 \tabularnewline
3 & 0.590472 & 4.5738 & 1.2e-05 \tabularnewline
4 & 0.452461 & 3.5047 & 0.000435 \tabularnewline
5 & 0.312534 & 2.4209 & 0.009263 \tabularnewline
6 & 0.178618 & 1.3836 & 0.085808 \tabularnewline
7 & 0.058162 & 0.4505 & 0.32698 \tabularnewline
8 & -0.055962 & -0.4335 & 0.33311 \tabularnewline
9 & -0.158912 & -1.2309 & 0.111577 \tabularnewline
10 & -0.247991 & -1.9209 & 0.029748 \tabularnewline
11 & -0.336245 & -2.6045 & 0.00579 \tabularnewline
12 & -0.433926 & -3.3612 & 0.000677 \tabularnewline
13 & -0.39015 & -3.0221 & 0.001844 \tabularnewline
14 & -0.338828 & -2.6245 & 0.005494 \tabularnewline
15 & -0.289064 & -2.2391 & 0.014435 \tabularnewline
16 & -0.246455 & -1.909 & 0.030522 \tabularnewline
17 & -0.203396 & -1.5755 & 0.0602 \tabularnewline
18 & -0.166432 & -1.2892 & 0.101143 \tabularnewline
19 & -0.132008 & -1.0225 & 0.155318 \tabularnewline
20 & -0.091311 & -0.7073 & 0.241062 \tabularnewline
21 & -0.05312 & -0.4115 & 0.341099 \tabularnewline
22 & -0.028892 & -0.2238 & 0.411839 \tabularnewline
23 & -0.00409 & -0.0317 & 0.487417 \tabularnewline
24 & 0.026174 & 0.2027 & 0.420011 \tabularnewline
25 & 0.023476 & 0.1818 & 0.42816 \tabularnewline
26 & 0.020973 & 0.1625 & 0.435747 \tabularnewline
27 & 0.01964 & 0.1521 & 0.439796 \tabularnewline
28 & 0.014377 & 0.1114 & 0.45585 \tabularnewline
29 & 0.006807 & 0.0527 & 0.479063 \tabularnewline
30 & 0.002886 & 0.0224 & 0.49112 \tabularnewline
31 & -0.007524 & -0.0583 & 0.47686 \tabularnewline
32 & -0.031618 & -0.2449 & 0.40368 \tabularnewline
33 & -0.060832 & -0.4712 & 0.319602 \tabularnewline
34 & -0.08059 & -0.6242 & 0.267417 \tabularnewline
35 & -0.100039 & -0.7749 & 0.220721 \tabularnewline
36 & -0.122818 & -0.9513 & 0.172623 \tabularnewline
37 & -0.114869 & -0.8898 & 0.188572 \tabularnewline
38 & -0.108679 & -0.8418 & 0.201614 \tabularnewline
39 & -0.10353 & -0.8019 & 0.212877 \tabularnewline
40 & -0.092515 & -0.7166 & 0.238195 \tabularnewline
41 & -0.07829 & -0.6064 & 0.273257 \tabularnewline
42 & -0.066665 & -0.5164 & 0.303742 \tabularnewline
43 & -0.053635 & -0.4155 & 0.339645 \tabularnewline
44 & -0.033758 & -0.2615 & 0.397305 \tabularnewline
45 & -0.010486 & -0.0812 & 0.467767 \tabularnewline
46 & 0.008634 & 0.0669 & 0.473451 \tabularnewline
47 & 0.027508 & 0.2131 & 0.415996 \tabularnewline
48 & 0.052138 & 0.4039 & 0.343876 \tabularnewline
\hline
\end{tabular}
%Source: https://freestatistics.org/blog/index.php?pk=&T=1

[TABLE]
[ROW][C]Autocorrelation Function[/C][/ROW]
[ROW][C]Time lag k[/C][C]ACF(k)[/C][C]T-STAT[/C][C]P-value[/C][/ROW]
[ROW][C]1[/C][C]0.870407[/C][C]6.7421[/C][C]0[/C][/ROW]
[ROW][C]2[/C][C]0.731561[/C][C]5.6667[/C][C]0[/C][/ROW]
[ROW][C]3[/C][C]0.590472[/C][C]4.5738[/C][C]1.2e-05[/C][/ROW]
[ROW][C]4[/C][C]0.452461[/C][C]3.5047[/C][C]0.000435[/C][/ROW]
[ROW][C]5[/C][C]0.312534[/C][C]2.4209[/C][C]0.009263[/C][/ROW]
[ROW][C]6[/C][C]0.178618[/C][C]1.3836[/C][C]0.085808[/C][/ROW]
[ROW][C]7[/C][C]0.058162[/C][C]0.4505[/C][C]0.32698[/C][/ROW]
[ROW][C]8[/C][C]-0.055962[/C][C]-0.4335[/C][C]0.33311[/C][/ROW]
[ROW][C]9[/C][C]-0.158912[/C][C]-1.2309[/C][C]0.111577[/C][/ROW]
[ROW][C]10[/C][C]-0.247991[/C][C]-1.9209[/C][C]0.029748[/C][/ROW]
[ROW][C]11[/C][C]-0.336245[/C][C]-2.6045[/C][C]0.00579[/C][/ROW]
[ROW][C]12[/C][C]-0.433926[/C][C]-3.3612[/C][C]0.000677[/C][/ROW]
[ROW][C]13[/C][C]-0.39015[/C][C]-3.0221[/C][C]0.001844[/C][/ROW]
[ROW][C]14[/C][C]-0.338828[/C][C]-2.6245[/C][C]0.005494[/C][/ROW]
[ROW][C]15[/C][C]-0.289064[/C][C]-2.2391[/C][C]0.014435[/C][/ROW]
[ROW][C]16[/C][C]-0.246455[/C][C]-1.909[/C][C]0.030522[/C][/ROW]
[ROW][C]17[/C][C]-0.203396[/C][C]-1.5755[/C][C]0.0602[/C][/ROW]
[ROW][C]18[/C][C]-0.166432[/C][C]-1.2892[/C][C]0.101143[/C][/ROW]
[ROW][C]19[/C][C]-0.132008[/C][C]-1.0225[/C][C]0.155318[/C][/ROW]
[ROW][C]20[/C][C]-0.091311[/C][C]-0.7073[/C][C]0.241062[/C][/ROW]
[ROW][C]21[/C][C]-0.05312[/C][C]-0.4115[/C][C]0.341099[/C][/ROW]
[ROW][C]22[/C][C]-0.028892[/C][C]-0.2238[/C][C]0.411839[/C][/ROW]
[ROW][C]23[/C][C]-0.00409[/C][C]-0.0317[/C][C]0.487417[/C][/ROW]
[ROW][C]24[/C][C]0.026174[/C][C]0.2027[/C][C]0.420011[/C][/ROW]
[ROW][C]25[/C][C]0.023476[/C][C]0.1818[/C][C]0.42816[/C][/ROW]
[ROW][C]26[/C][C]0.020973[/C][C]0.1625[/C][C]0.435747[/C][/ROW]
[ROW][C]27[/C][C]0.01964[/C][C]0.1521[/C][C]0.439796[/C][/ROW]
[ROW][C]28[/C][C]0.014377[/C][C]0.1114[/C][C]0.45585[/C][/ROW]
[ROW][C]29[/C][C]0.006807[/C][C]0.0527[/C][C]0.479063[/C][/ROW]
[ROW][C]30[/C][C]0.002886[/C][C]0.0224[/C][C]0.49112[/C][/ROW]
[ROW][C]31[/C][C]-0.007524[/C][C]-0.0583[/C][C]0.47686[/C][/ROW]
[ROW][C]32[/C][C]-0.031618[/C][C]-0.2449[/C][C]0.40368[/C][/ROW]
[ROW][C]33[/C][C]-0.060832[/C][C]-0.4712[/C][C]0.319602[/C][/ROW]
[ROW][C]34[/C][C]-0.08059[/C][C]-0.6242[/C][C]0.267417[/C][/ROW]
[ROW][C]35[/C][C]-0.100039[/C][C]-0.7749[/C][C]0.220721[/C][/ROW]
[ROW][C]36[/C][C]-0.122818[/C][C]-0.9513[/C][C]0.172623[/C][/ROW]
[ROW][C]37[/C][C]-0.114869[/C][C]-0.8898[/C][C]0.188572[/C][/ROW]
[ROW][C]38[/C][C]-0.108679[/C][C]-0.8418[/C][C]0.201614[/C][/ROW]
[ROW][C]39[/C][C]-0.10353[/C][C]-0.8019[/C][C]0.212877[/C][/ROW]
[ROW][C]40[/C][C]-0.092515[/C][C]-0.7166[/C][C]0.238195[/C][/ROW]
[ROW][C]41[/C][C]-0.07829[/C][C]-0.6064[/C][C]0.273257[/C][/ROW]
[ROW][C]42[/C][C]-0.066665[/C][C]-0.5164[/C][C]0.303742[/C][/ROW]
[ROW][C]43[/C][C]-0.053635[/C][C]-0.4155[/C][C]0.339645[/C][/ROW]
[ROW][C]44[/C][C]-0.033758[/C][C]-0.2615[/C][C]0.397305[/C][/ROW]
[ROW][C]45[/C][C]-0.010486[/C][C]-0.0812[/C][C]0.467767[/C][/ROW]
[ROW][C]46[/C][C]0.008634[/C][C]0.0669[/C][C]0.473451[/C][/ROW]
[ROW][C]47[/C][C]0.027508[/C][C]0.2131[/C][C]0.415996[/C][/ROW]
[ROW][C]48[/C][C]0.052138[/C][C]0.4039[/C][C]0.343876[/C][/ROW]
[/TABLE]
Source: https://freestatistics.org/blog/index.php?pk=&T=1

Globally Unique Identifier (entire table): ba.freestatistics.org/blog/index.php?pk=&T=1

As an alternative you can also use a QR Code:  

The GUIDs for individual cells are displayed in the table below:

Autocorrelation Function
Time lag kACF(k)T-STATP-value
10.8704076.74210
20.7315615.66670
30.5904724.57381.2e-05
40.4524613.50470.000435
50.3125342.42090.009263
60.1786181.38360.085808
70.0581620.45050.32698
8-0.055962-0.43350.33311
9-0.158912-1.23090.111577
10-0.247991-1.92090.029748
11-0.336245-2.60450.00579
12-0.433926-3.36120.000677
13-0.39015-3.02210.001844
14-0.338828-2.62450.005494
15-0.289064-2.23910.014435
16-0.246455-1.9090.030522
17-0.203396-1.57550.0602
18-0.166432-1.28920.101143
19-0.132008-1.02250.155318
20-0.091311-0.70730.241062
21-0.05312-0.41150.341099
22-0.028892-0.22380.411839
23-0.00409-0.03170.487417
240.0261740.20270.420011
250.0234760.18180.42816
260.0209730.16250.435747
270.019640.15210.439796
280.0143770.11140.45585
290.0068070.05270.479063
300.0028860.02240.49112
31-0.007524-0.05830.47686
32-0.031618-0.24490.40368
33-0.060832-0.47120.319602
34-0.08059-0.62420.267417
35-0.100039-0.77490.220721
36-0.122818-0.95130.172623
37-0.114869-0.88980.188572
38-0.108679-0.84180.201614
39-0.10353-0.80190.212877
40-0.092515-0.71660.238195
41-0.07829-0.60640.273257
42-0.066665-0.51640.303742
43-0.053635-0.41550.339645
44-0.033758-0.26150.397305
45-0.010486-0.08120.467767
460.0086340.06690.473451
470.0275080.21310.415996
480.0521380.40390.343876


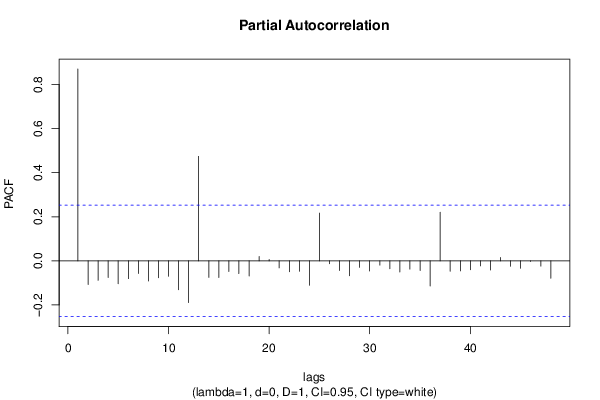
Partial Autocorrelation Function
Time lag kPACF(k)T-STATP-value
10.8704076.74210
2-0.107461-0.83240.204246
3-0.088384-0.68460.24811
4-0.075276-0.58310.281011
5-0.103859-0.80450.212145
6-0.080647-0.62470.267272
7-0.056984-0.44140.330256
8-0.091472-0.70850.240676
9-0.07637-0.59160.278184
10-0.069516-0.53850.296124
11-0.130747-1.01280.15762
12-0.189288-1.46620.073905
130.4738153.67020.000259
14-0.075007-0.5810.281707
15-0.075659-0.58610.280019
16-0.048288-0.3740.354848
17-0.057784-0.44760.328029
18-0.068435-0.53010.299001
190.0200520.15530.438543
200.0062810.04870.48068
21-0.031763-0.2460.403246
22-0.049497-0.38340.351388
23-0.047245-0.3660.357842
24-0.110306-0.85440.198134
250.2166341.6780.049271
26-0.012772-0.09890.460761
27-0.044126-0.34180.366848
28-0.067363-0.52180.301868
29-0.02966-0.22970.409535
30-0.045975-0.35610.361501
31-0.019354-0.14990.440667
32-0.035845-0.27770.391116
33-0.050768-0.39320.347765
34-0.037402-0.28970.386516
35-0.043583-0.33760.368423
36-0.11384-0.88180.190703
370.2203851.70710.046487
38-0.047305-0.36640.35767
39-0.045434-0.35190.36306
40-0.039981-0.30970.378934
41-0.022839-0.17690.430088
42-0.041116-0.31850.375613
430.0149430.11570.454121
44-0.024577-0.19040.424829
45-0.03323-0.25740.398876
46-0.003242-0.02510.490023
47-0.024055-0.18630.426408
48-0.078993-0.61190.271465

\begin{tabular}{lllllllll}
\hline
Partial Autocorrelation Function \tabularnewline
Time lag k & PACF(k) & T-STAT & P-value \tabularnewline
1 & 0.870407 & 6.7421 & 0 \tabularnewline
2 & -0.107461 & -0.8324 & 0.204246 \tabularnewline
3 & -0.088384 & -0.6846 & 0.24811 \tabularnewline
4 & -0.075276 & -0.5831 & 0.281011 \tabularnewline
5 & -0.103859 & -0.8045 & 0.212145 \tabularnewline
6 & -0.080647 & -0.6247 & 0.267272 \tabularnewline
7 & -0.056984 & -0.4414 & 0.330256 \tabularnewline
8 & -0.091472 & -0.7085 & 0.240676 \tabularnewline
9 & -0.07637 & -0.5916 & 0.278184 \tabularnewline
10 & -0.069516 & -0.5385 & 0.296124 \tabularnewline
11 & -0.130747 & -1.0128 & 0.15762 \tabularnewline
12 & -0.189288 & -1.4662 & 0.073905 \tabularnewline
13 & 0.473815 & 3.6702 & 0.000259 \tabularnewline
14 & -0.075007 & -0.581 & 0.281707 \tabularnewline
15 & -0.075659 & -0.5861 & 0.280019 \tabularnewline
16 & -0.048288 & -0.374 & 0.354848 \tabularnewline
17 & -0.057784 & -0.4476 & 0.328029 \tabularnewline
18 & -0.068435 & -0.5301 & 0.299001 \tabularnewline
19 & 0.020052 & 0.1553 & 0.438543 \tabularnewline
20 & 0.006281 & 0.0487 & 0.48068 \tabularnewline
21 & -0.031763 & -0.246 & 0.403246 \tabularnewline
22 & -0.049497 & -0.3834 & 0.351388 \tabularnewline
23 & -0.047245 & -0.366 & 0.357842 \tabularnewline
24 & -0.110306 & -0.8544 & 0.198134 \tabularnewline
25 & 0.216634 & 1.678 & 0.049271 \tabularnewline
26 & -0.012772 & -0.0989 & 0.460761 \tabularnewline
27 & -0.044126 & -0.3418 & 0.366848 \tabularnewline
28 & -0.067363 & -0.5218 & 0.301868 \tabularnewline
29 & -0.02966 & -0.2297 & 0.409535 \tabularnewline
30 & -0.045975 & -0.3561 & 0.361501 \tabularnewline
31 & -0.019354 & -0.1499 & 0.440667 \tabularnewline
32 & -0.035845 & -0.2777 & 0.391116 \tabularnewline
33 & -0.050768 & -0.3932 & 0.347765 \tabularnewline
34 & -0.037402 & -0.2897 & 0.386516 \tabularnewline
35 & -0.043583 & -0.3376 & 0.368423 \tabularnewline
36 & -0.11384 & -0.8818 & 0.190703 \tabularnewline
37 & 0.220385 & 1.7071 & 0.046487 \tabularnewline
38 & -0.047305 & -0.3664 & 0.35767 \tabularnewline
39 & -0.045434 & -0.3519 & 0.36306 \tabularnewline
40 & -0.039981 & -0.3097 & 0.378934 \tabularnewline
41 & -0.022839 & -0.1769 & 0.430088 \tabularnewline
42 & -0.041116 & -0.3185 & 0.375613 \tabularnewline
43 & 0.014943 & 0.1157 & 0.454121 \tabularnewline
44 & -0.024577 & -0.1904 & 0.424829 \tabularnewline
45 & -0.03323 & -0.2574 & 0.398876 \tabularnewline
46 & -0.003242 & -0.0251 & 0.490023 \tabularnewline
47 & -0.024055 & -0.1863 & 0.426408 \tabularnewline
48 & -0.078993 & -0.6119 & 0.271465 \tabularnewline
\hline
\end{tabular}
%Source: https://freestatistics.org/blog/index.php?pk=&T=2

[TABLE]
[ROW][C]Partial Autocorrelation Function[/C][/ROW]
[ROW][C]Time lag k[/C][C]PACF(k)[/C][C]T-STAT[/C][C]P-value[/C][/ROW]
[ROW][C]1[/C][C]0.870407[/C][C]6.7421[/C][C]0[/C][/ROW]
[ROW][C]2[/C][C]-0.107461[/C][C]-0.8324[/C][C]0.204246[/C][/ROW]
[ROW][C]3[/C][C]-0.088384[/C][C]-0.6846[/C][C]0.24811[/C][/ROW]
[ROW][C]4[/C][C]-0.075276[/C][C]-0.5831[/C][C]0.281011[/C][/ROW]
[ROW][C]5[/C][C]-0.103859[/C][C]-0.8045[/C][C]0.212145[/C][/ROW]
[ROW][C]6[/C][C]-0.080647[/C][C]-0.6247[/C][C]0.267272[/C][/ROW]
[ROW][C]7[/C][C]-0.056984[/C][C]-0.4414[/C][C]0.330256[/C][/ROW]
[ROW][C]8[/C][C]-0.091472[/C][C]-0.7085[/C][C]0.240676[/C][/ROW]
[ROW][C]9[/C][C]-0.07637[/C][C]-0.5916[/C][C]0.278184[/C][/ROW]
[ROW][C]10[/C][C]-0.069516[/C][C]-0.5385[/C][C]0.296124[/C][/ROW]
[ROW][C]11[/C][C]-0.130747[/C][C]-1.0128[/C][C]0.15762[/C][/ROW]
[ROW][C]12[/C][C]-0.189288[/C][C]-1.4662[/C][C]0.073905[/C][/ROW]
[ROW][C]13[/C][C]0.473815[/C][C]3.6702[/C][C]0.000259[/C][/ROW]
[ROW][C]14[/C][C]-0.075007[/C][C]-0.581[/C][C]0.281707[/C][/ROW]
[ROW][C]15[/C][C]-0.075659[/C][C]-0.5861[/C][C]0.280019[/C][/ROW]
[ROW][C]16[/C][C]-0.048288[/C][C]-0.374[/C][C]0.354848[/C][/ROW]
[ROW][C]17[/C][C]-0.057784[/C][C]-0.4476[/C][C]0.328029[/C][/ROW]
[ROW][C]18[/C][C]-0.068435[/C][C]-0.5301[/C][C]0.299001[/C][/ROW]
[ROW][C]19[/C][C]0.020052[/C][C]0.1553[/C][C]0.438543[/C][/ROW]
[ROW][C]20[/C][C]0.006281[/C][C]0.0487[/C][C]0.48068[/C][/ROW]
[ROW][C]21[/C][C]-0.031763[/C][C]-0.246[/C][C]0.403246[/C][/ROW]
[ROW][C]22[/C][C]-0.049497[/C][C]-0.3834[/C][C]0.351388[/C][/ROW]
[ROW][C]23[/C][C]-0.047245[/C][C]-0.366[/C][C]0.357842[/C][/ROW]
[ROW][C]24[/C][C]-0.110306[/C][C]-0.8544[/C][C]0.198134[/C][/ROW]
[ROW][C]25[/C][C]0.216634[/C][C]1.678[/C][C]0.049271[/C][/ROW]
[ROW][C]26[/C][C]-0.012772[/C][C]-0.0989[/C][C]0.460761[/C][/ROW]
[ROW][C]27[/C][C]-0.044126[/C][C]-0.3418[/C][C]0.366848[/C][/ROW]
[ROW][C]28[/C][C]-0.067363[/C][C]-0.5218[/C][C]0.301868[/C][/ROW]
[ROW][C]29[/C][C]-0.02966[/C][C]-0.2297[/C][C]0.409535[/C][/ROW]
[ROW][C]30[/C][C]-0.045975[/C][C]-0.3561[/C][C]0.361501[/C][/ROW]
[ROW][C]31[/C][C]-0.019354[/C][C]-0.1499[/C][C]0.440667[/C][/ROW]
[ROW][C]32[/C][C]-0.035845[/C][C]-0.2777[/C][C]0.391116[/C][/ROW]
[ROW][C]33[/C][C]-0.050768[/C][C]-0.3932[/C][C]0.347765[/C][/ROW]
[ROW][C]34[/C][C]-0.037402[/C][C]-0.2897[/C][C]0.386516[/C][/ROW]
[ROW][C]35[/C][C]-0.043583[/C][C]-0.3376[/C][C]0.368423[/C][/ROW]
[ROW][C]36[/C][C]-0.11384[/C][C]-0.8818[/C][C]0.190703[/C][/ROW]
[ROW][C]37[/C][C]0.220385[/C][C]1.7071[/C][C]0.046487[/C][/ROW]
[ROW][C]38[/C][C]-0.047305[/C][C]-0.3664[/C][C]0.35767[/C][/ROW]
[ROW][C]39[/C][C]-0.045434[/C][C]-0.3519[/C][C]0.36306[/C][/ROW]
[ROW][C]40[/C][C]-0.039981[/C][C]-0.3097[/C][C]0.378934[/C][/ROW]
[ROW][C]41[/C][C]-0.022839[/C][C]-0.1769[/C][C]0.430088[/C][/ROW]
[ROW][C]42[/C][C]-0.041116[/C][C]-0.3185[/C][C]0.375613[/C][/ROW]
[ROW][C]43[/C][C]0.014943[/C][C]0.1157[/C][C]0.454121[/C][/ROW]
[ROW][C]44[/C][C]-0.024577[/C][C]-0.1904[/C][C]0.424829[/C][/ROW]
[ROW][C]45[/C][C]-0.03323[/C][C]-0.2574[/C][C]0.398876[/C][/ROW]
[ROW][C]46[/C][C]-0.003242[/C][C]-0.0251[/C][C]0.490023[/C][/ROW]
[ROW][C]47[/C][C]-0.024055[/C][C]-0.1863[/C][C]0.426408[/C][/ROW]
[ROW][C]48[/C][C]-0.078993[/C][C]-0.6119[/C][C]0.271465[/C][/ROW]
[/TABLE]
Source: https://freestatistics.org/blog/index.php?pk=&T=2

Globally Unique Identifier (entire table): ba.freestatistics.org/blog/index.php?pk=&T=2

As an alternative you can also use a QR Code:  

The GUIDs for individual cells are displayed in the table below:

Partial Autocorrelation Function
Time lag kPACF(k)T-STATP-value
10.8704076.74210
2-0.107461-0.83240.204246
3-0.088384-0.68460.24811
4-0.075276-0.58310.281011
5-0.103859-0.80450.212145
6-0.080647-0.62470.267272
7-0.056984-0.44140.330256
8-0.091472-0.70850.240676
9-0.07637-0.59160.278184
10-0.069516-0.53850.296124
11-0.130747-1.01280.15762
12-0.189288-1.46620.073905
130.4738153.67020.000259
14-0.075007-0.5810.281707
15-0.075659-0.58610.280019
16-0.048288-0.3740.354848
17-0.057784-0.44760.328029
18-0.068435-0.53010.299001
190.0200520.15530.438543
200.0062810.04870.48068
21-0.031763-0.2460.403246
22-0.049497-0.38340.351388
23-0.047245-0.3660.357842
24-0.110306-0.85440.198134
250.2166341.6780.049271
26-0.012772-0.09890.460761
27-0.044126-0.34180.366848
28-0.067363-0.52180.301868
29-0.02966-0.22970.409535
30-0.045975-0.35610.361501
31-0.019354-0.14990.440667
32-0.035845-0.27770.391116
33-0.050768-0.39320.347765
34-0.037402-0.28970.386516
35-0.043583-0.33760.368423
36-0.11384-0.88180.190703
370.2203851.70710.046487
38-0.047305-0.36640.35767
39-0.045434-0.35190.36306
40-0.039981-0.30970.378934
41-0.022839-0.17690.430088
42-0.041116-0.31850.375613
430.0149430.11570.454121
44-0.024577-0.19040.424829
45-0.03323-0.25740.398876
46-0.003242-0.02510.490023
47-0.024055-0.18630.426408
48-0.078993-0.61190.271465


Parameters (Session):
par1 = 48 ; par2 = 1 ; par3 = 0 ; par4 = 1 ; par5 = 12 ; par6 = White Noise ; par7 = 0.95 ;
Parameters (R input):
par1 = 48 ; par2 = 1 ; par3 = 0 ; par4 = 1 ; par5 = 12 ; par6 = White Noise ; par7 = 0.95 ; par8 = ;
R code (references can be found in the software module):
par8 <- ''
par7 <- '0.95'
par6 <- 'White Noise'
par5 <- '12'
par4 <- '0'
par3 <- '0'
par2 <- '1'
par1 <- '48'
if (par1 == 'Default') {
par1 = 10*log10(length(x))
} else {
par1 <- as.numeric(par1)
}
par2 <- as.numeric(par2)
par3 <- as.numeric(par3)
par4 <- as.numeric(par4)
par5 <- as.numeric(par5)
if (par6 == 'White Noise') par6 <- 'white' else par6 <- 'ma'
par7 <- as.numeric(par7)
if (par8 != '') par8 <- as.numeric(par8)
x <- na.omit(x)
ox <- x
if (par8 == '') {
if (par2 == 0) {
x <- log(x)
} else {
x <- (x ^ par2 - 1) / par2
}
} else {
x <- log(x,base=par8)
}
if (par3 > 0) x <- diff(x,lag=1,difference=par3)
if (par4 > 0) x <- diff(x,lag=par5,difference=par4)
bitmap(file='picts.png')
op <- par(mfrow=c(2,1))
plot(ox,type='l',main='Original Time Series',xlab='time',ylab='value')
if (par8=='') {
mytitle <- paste('Working Time Series (lambda=',par2,', d=',par3,', D=',par4,')',sep='')
mysub <- paste('(lambda=',par2,', d=',par3,', D=',par4,', CI=', par7, ', CI type=',par6,')',sep='')
} else {
mytitle <- paste('Working Time Series (base=',par8,', d=',par3,', D=',par4,')',sep='')
mysub <- paste('(base=',par8,', d=',par3,', D=',par4,', CI=', par7, ', CI type=',par6,')',sep='')
}
plot(x,type='l', main=mytitle,xlab='time',ylab='value')
par(op)
dev.off()
bitmap(file='pic1.png')
racf <- acf(x, par1, main='Autocorrelation', xlab='time lag', ylab='ACF', ci.type=par6, ci=par7, sub=mysub)
dev.off()
bitmap(file='pic2.png')
rpacf <- pacf(x,par1,main='Partial Autocorrelation',xlab='lags',ylab='PACF',sub=mysub)
dev.off()
(myacf <- c(racf$acf))
(mypacf <- c(rpacf$acf))
lengthx <- length(x)
sqrtn <- sqrt(lengthx)
load(file='createtable')
a<-table.start()
a<-table.row.start(a)
a<-table.element(a,'Autocorrelation Function',4,TRUE)
a<-table.row.end(a)
a<-table.row.start(a)
a<-table.element(a,'Time lag k',header=TRUE)
a<-table.element(a,hyperlink('basics.htm','ACF(k)','click here for more information about the Autocorrelation Function'),header=TRUE)
a<-table.element(a,'T-STAT',header=TRUE)
a<-table.element(a,'P-value',header=TRUE)
a<-table.row.end(a)
for (i in 2:(par1+1)) {
a<-table.row.start(a)
a<-table.element(a,i-1,header=TRUE)
a<-table.element(a,round(myacf[i],6))
mytstat <- myacf[i]*sqrtn
a<-table.element(a,round(mytstat,4))
a<-table.element(a,round(1-pt(abs(mytstat),lengthx),6))
a<-table.row.end(a)
}
a<-table.end(a)
table.save(a,file='mytable.tab')
a<-table.start()
a<-table.row.start(a)
a<-table.element(a,'Partial Autocorrelation Function',4,TRUE)
a<-table.row.end(a)
a<-table.row.start(a)
a<-table.element(a,'Time lag k',header=TRUE)
a<-table.element(a,hyperlink('basics.htm','PACF(k)','click here for more information about the Partial Autocorrelation Function'),header=TRUE)
a<-table.element(a,'T-STAT',header=TRUE)
a<-table.element(a,'P-value',header=TRUE)
a<-table.row.end(a)
for (i in 1:par1) {
a<-table.row.start(a)
a<-table.element(a,i,header=TRUE)
a<-table.element(a,round(mypacf[i],6))
mytstat <- mypacf[i]*sqrtn
a<-table.element(a,round(mytstat,4))
a<-table.element(a,round(1-pt(abs(mytstat),lengthx),6))
a<-table.row.end(a)
}
a<-table.end(a)
table.save(a,file='mytable1.tab')